Anleitung & Dokumentation
Waldgärten gestalten mit dem Perma Design Kit
Digitales Planungstool für permanente Nutzpflanzensysteme – ein Designwerkzeug zur Flächenplanung in Waldgärten.
So planst du
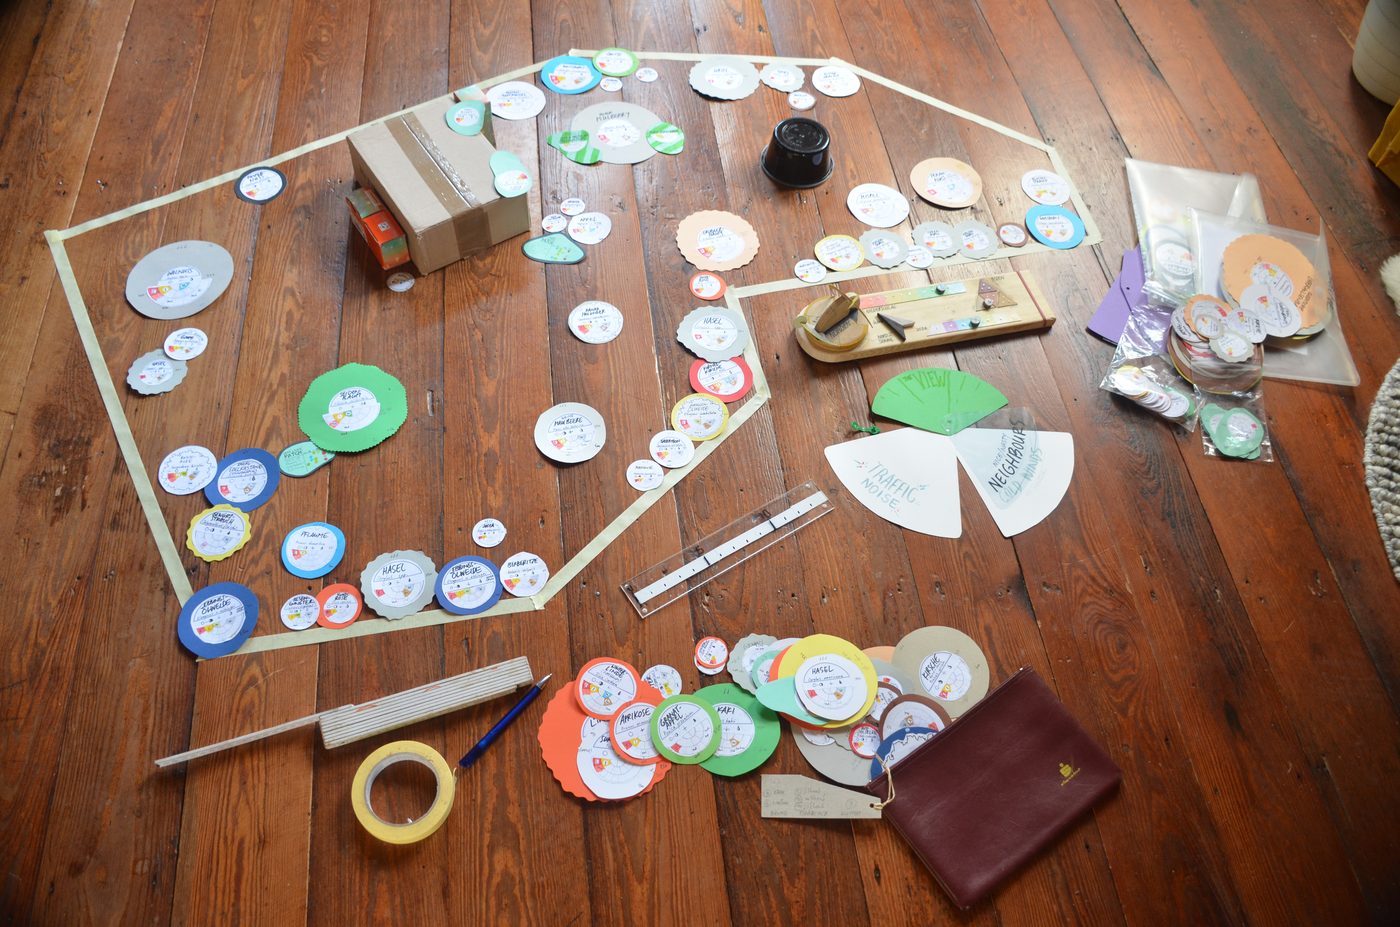
Auf dem Boden
- Designziel und Standort kennen. Klarheit haben, was erreicht werden soll. Sonne, Wind, Wasser, Boden und Umgebung beobachten, Standortfaktoren recherchieren und dokumentieren.
- Pflanzenliste. Eine vorhandene Liste importieren oder unter Pflanzen die gewünschten Arten suchen und die Daten vervollständigen lassen.
- Baumscheiben drucken. In der Kartenansicht das maßstabsgetreue PDF (1:50) drucken, ausschneiden und anpassen.
- Grundkarte anlegen. Die Grenzen der Fläche im selben Maßstab auf eine beliebige Oberfläche übertragen, die Standortdaten übersichtlich daneben.
- Platzieren und verschieben. Nach Schichten: erst Bäume, dann Sträucher, dann Stauden, zuletzt Kletterpflanzen. Entwürfe fotografieren und verbessern, bis alle Pflanzen gut untergebracht sind.
Im Waldgartenplan
- Fläche zeichnen. Adresse suchen und den Garten auf der Karte umranden. Größe, Nordung und Gelände ergeben sich daraus.
- Pflanzen setzen. Pflanze wählen und auf die Fläche tippen – einzeln, als Reihe oder als ganze Polykultur.
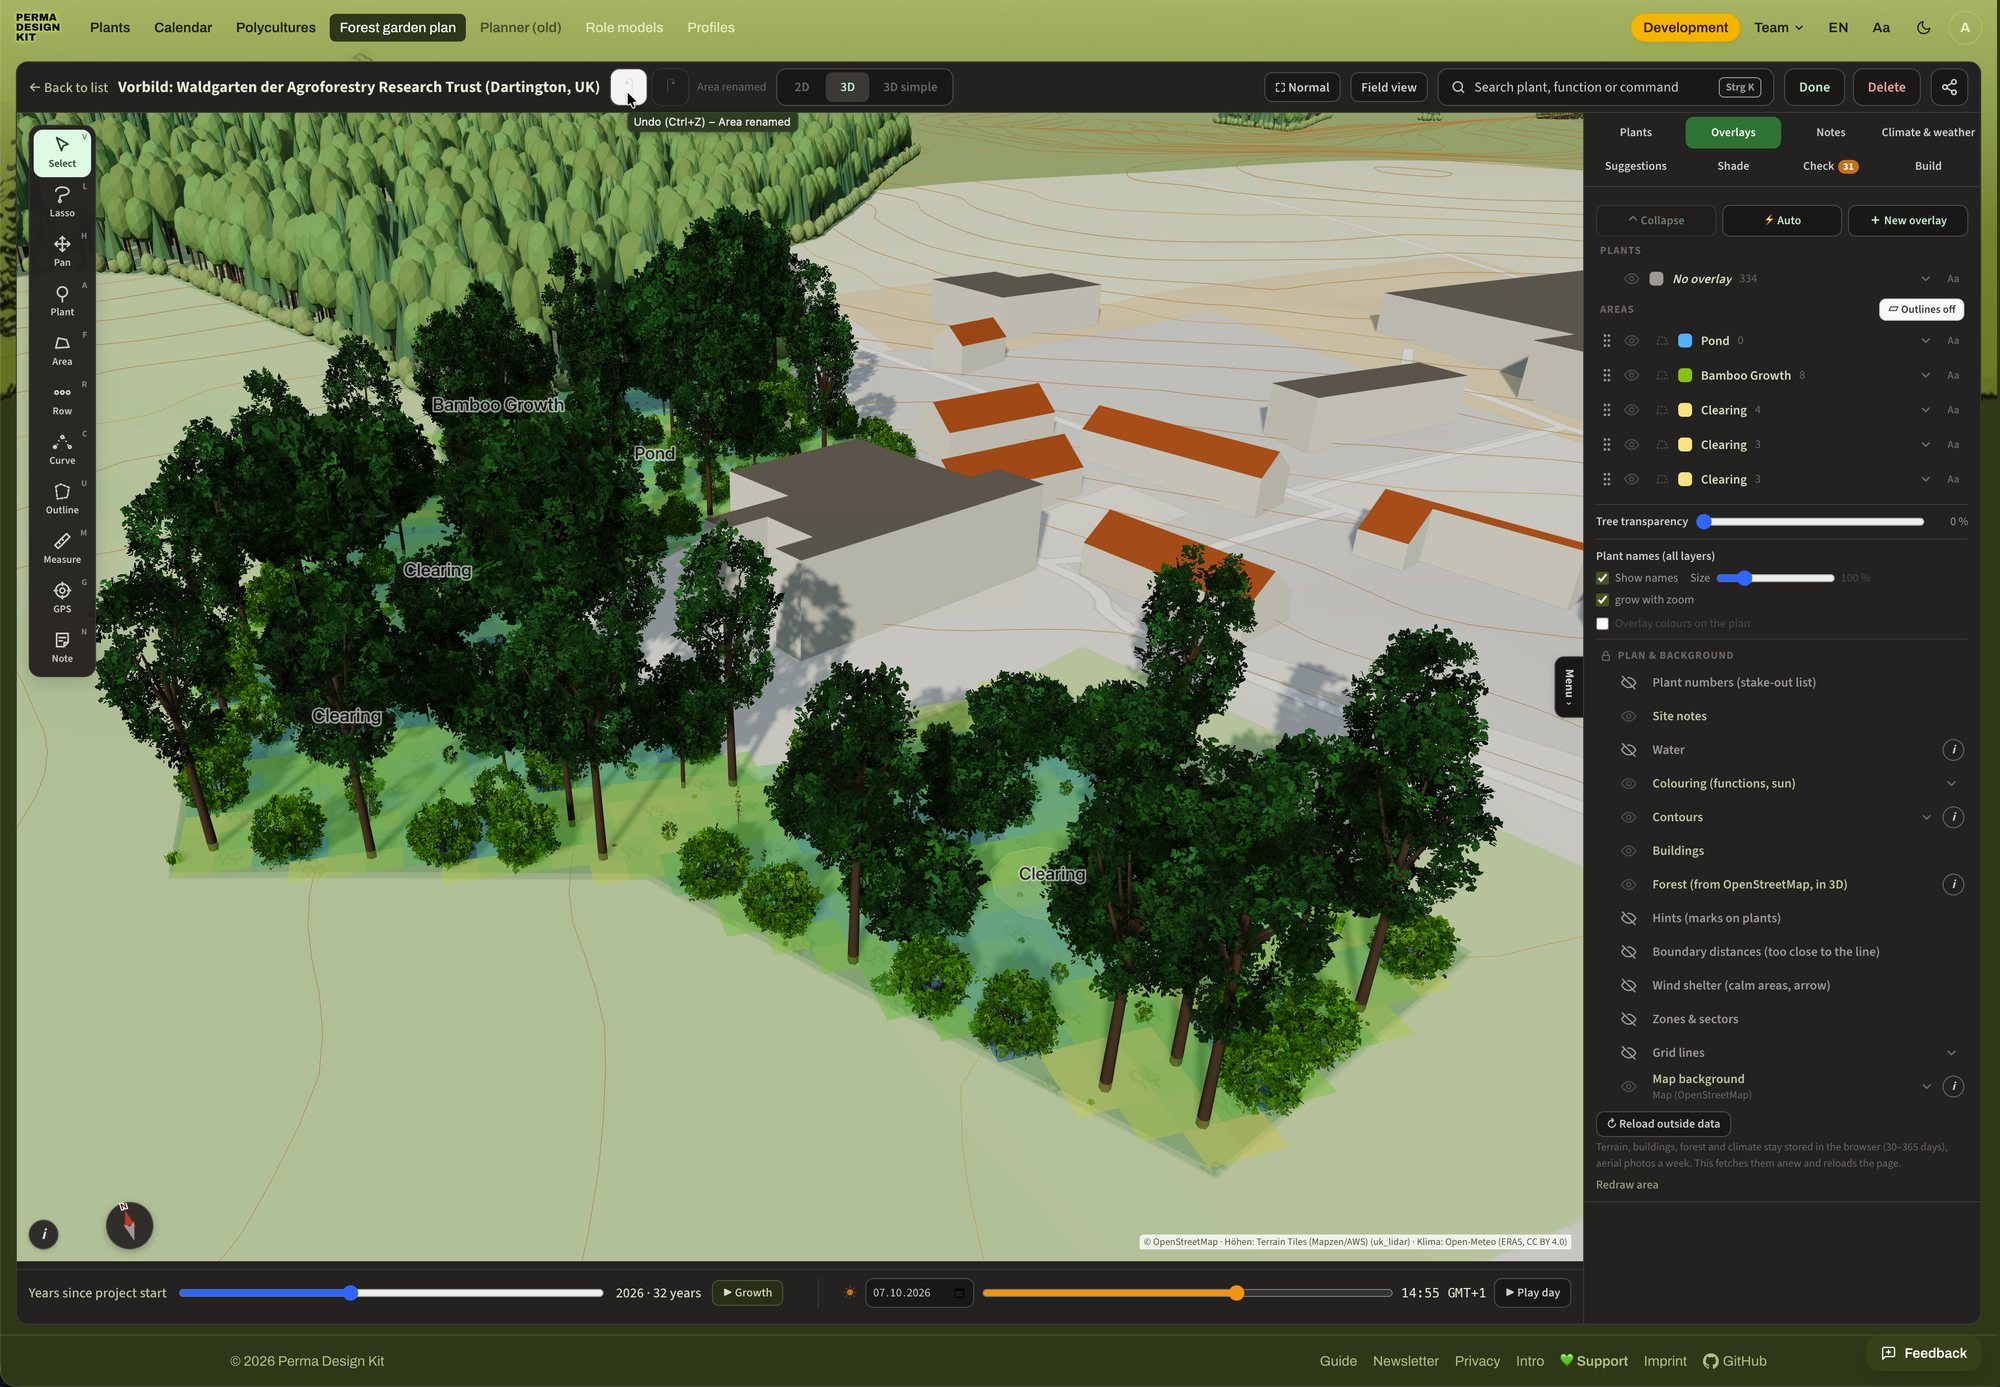
- Wachsen lassen und prüfen. Mit dem Jahre-Regler in 2D oder 3D wachsen lassen, Besonnung prüfen und Lücken bei den Funktionen schließen.
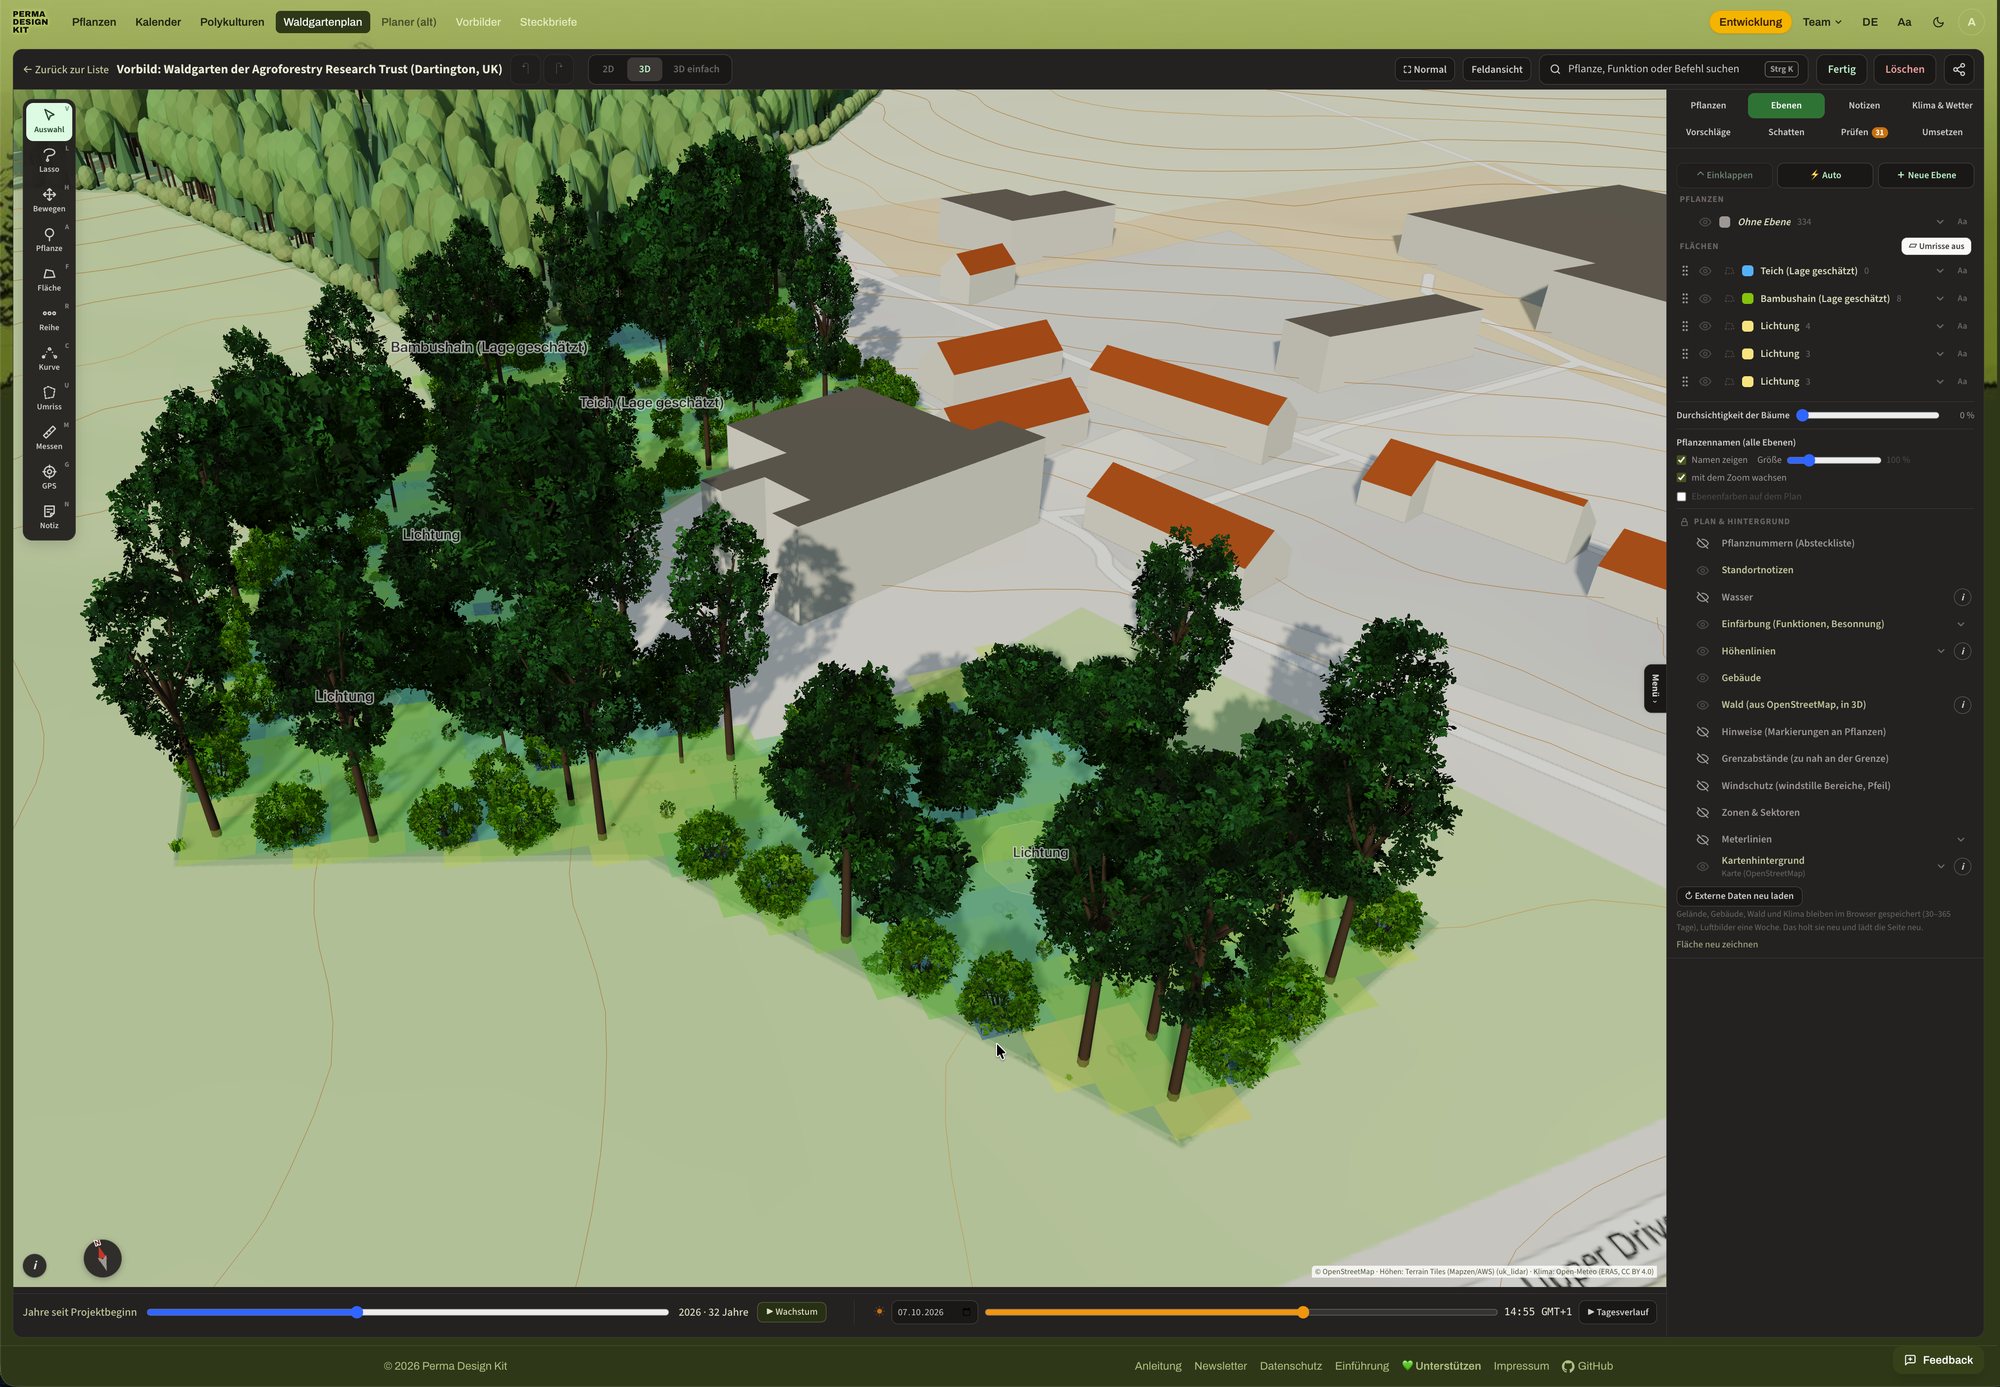
Beides verbinden: gemeinsam auf dem Boden auslegen und diskutieren, danach das Ergebnis in den Waldgartenplan übertragen, dort wachsen lassen, ausdrucken und teilen. Deine Daten bleiben dabei auf deinem Gerät.
1Idee & KonzeptWarum Baumscheiben auf einer Grundkarte
Das Perma Design Kit entstand ursprünglich aus der Suche nach einer flexiblen Methode, mehrschichtige Waldgärten zu planen. Gezeichnete Pläne sind starr und mühsam zu ändern. Am Bildschirm geht dies leichter, dabei gehen aber das Räumliche und das gemeinsame Planen verloren. So entstand die Idee, beide Welten zu verbinden: Baumscheiben, die eine Pflanze mit ihren Eigenschaften charakterisieren, werden auf einem vorab abgesteckten Grundriss der Fläche in einem anschaulichen Maßstab platziert – spielerisch und im Team. Auf der Baumscheibe stehen die wichtigsten Daten zur ökologischen Nische der Pflanze. So bleibt beim Platzieren immer im Blick, was sie braucht und was sie leistet.
Zentral ist also das Set von Baumscheiben, die den Kronendurchmesser der ausgewachsenen Pflanze im gewählten Maßstab abbilden. Die Software erlaubt es, ein solches Set im gewünschten Maßstab zu erstellen und auszudrucken.
Im Folgenden ist beschrieben, wie man die Software zu diesem Zweck verwendet und was sie darüber hinaus bietet.
2AnwendungsmöglichkeitenFlächendesign, gemeinsames Planen, Bildung
Flächendesign
Das Perma Design Kit ist ein visuelles Hilfsmittel zum Flächendesign, genauer zur konkreten Platzierung von Elementen (Pflanzen). Es ermöglicht besseres Design im Sinne einer möglichst guten Positionierung der Elemente in Beziehung zueinander („knowing what goes where“). Die Software erzeugt dazu die analogen Baumscheiben zum Ausdrucken; das Flächendesign kann aber auch digital im Waldgartenplan erfolgen.
Auf beide Arten ist es ein Werkzeug, das auch in einer Gruppe funktioniert und die gemeinsame Planung von Gemeinschaftsflächen erlaubt.
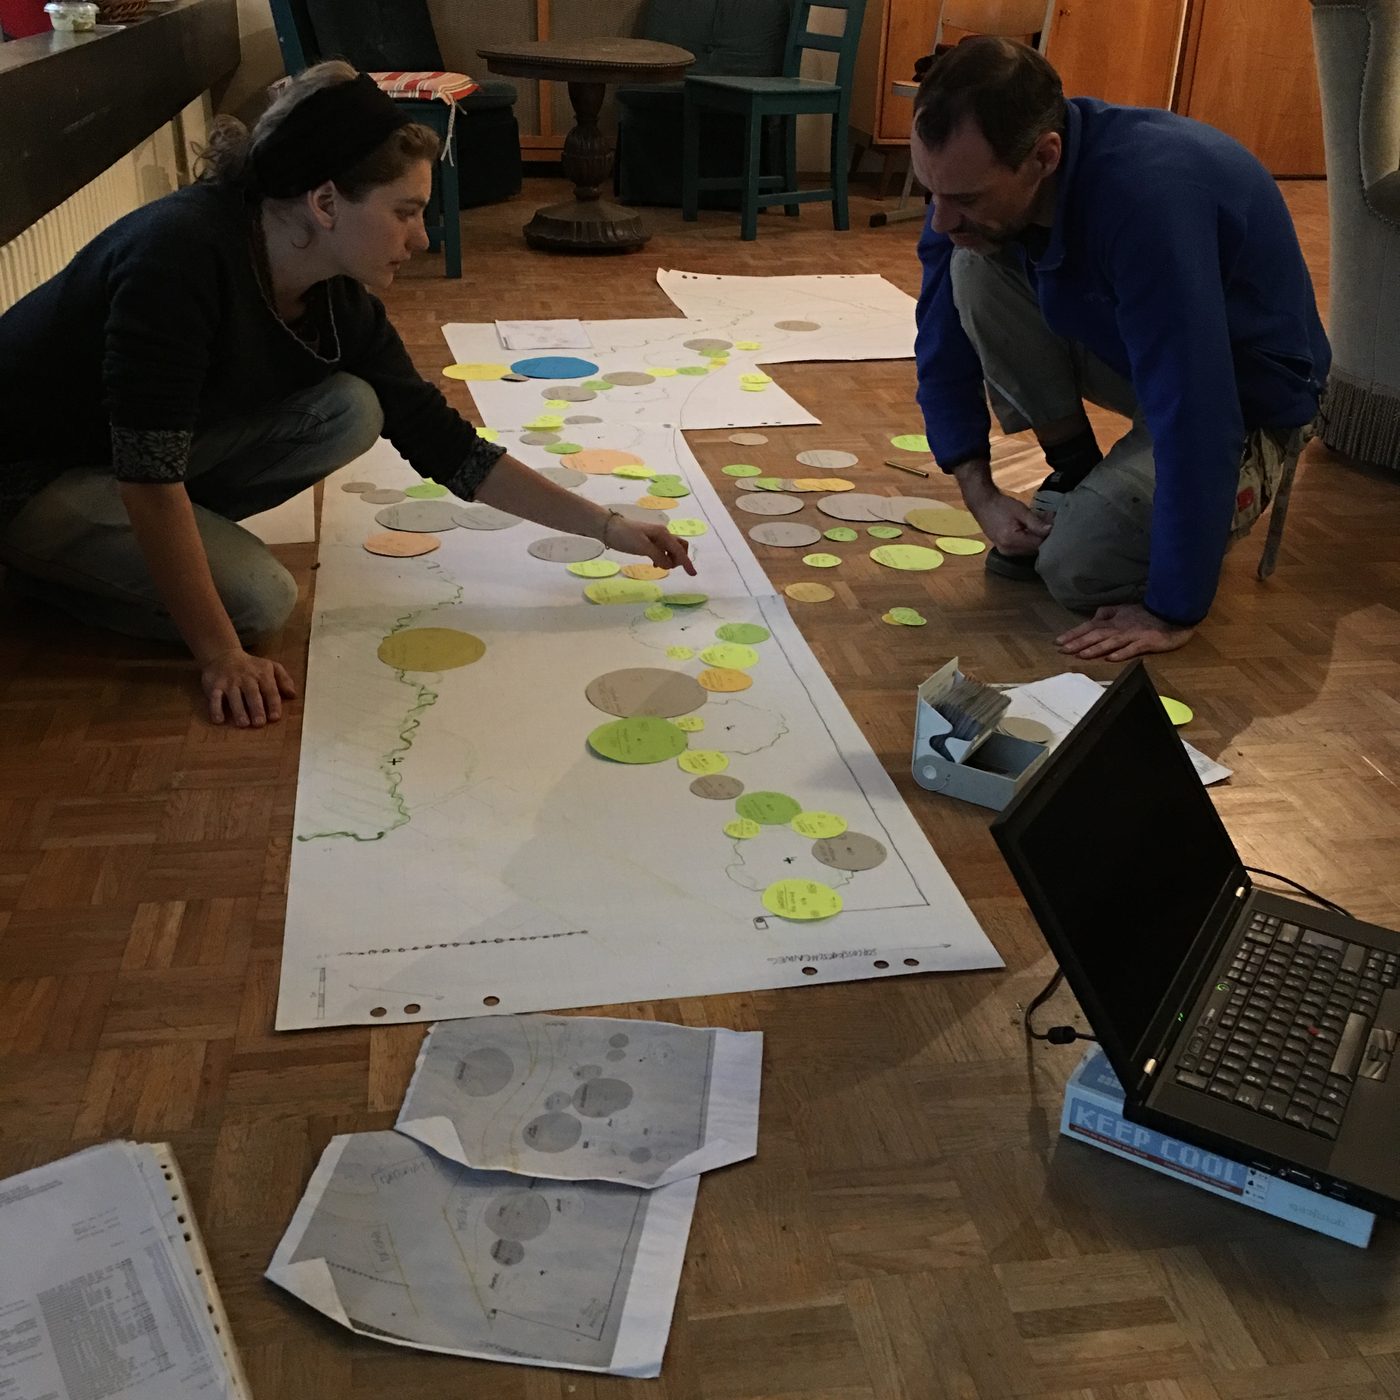
Bildung
Das Perma Design Kit funktioniert auch als Lehr- und Lernmittel für alle Ansätze der Landnutzung mit Bäumen. Es vermittelt Prinzipien des Flächendesigns spielerisch und schult das Vorstellungsvermögen für die dynamischen Beziehungsnetze in Raum und Zeit, die permanente Systeme auszeichnen.
Wer Pflanzenlisten erstellt und bearbeitet, erwirbt nebenbei spezialisiertes Pflanzenwissen zur ökologischen Nische. Einen besonders hohen Lerneffekt hat es, ein Set maßstabsgetreuer Baumscheiben zu erstellen und individuell anzupassen.
3Das analoge WerkzeugStandortanalyse, Grundkarte, Baumscheiben lesen und drucken, Pflanzen platzieren
So funktioniert das Tool als analoges Werkzeug zum Flächendesign – die fünf Schritte stehen oben unter So planst du, hier im Detail.
Von der Standortanalyse zur Grundkarte
Meist bezieht man sich auf eine konkrete Fläche, über die mehr oder weniger Wissen vorhanden ist.
Standortdaten sammeln
Beobachtung vor Ort und Recherche ergeben eine Sammlung von Daten zu den Bedingungen und Umgebungsfaktoren der Fläche: allgemeine Klimadaten und Mikroklima, Nutzungshistorie, Böden, Bestand an Pflanzen und Tieren und vieles mehr.
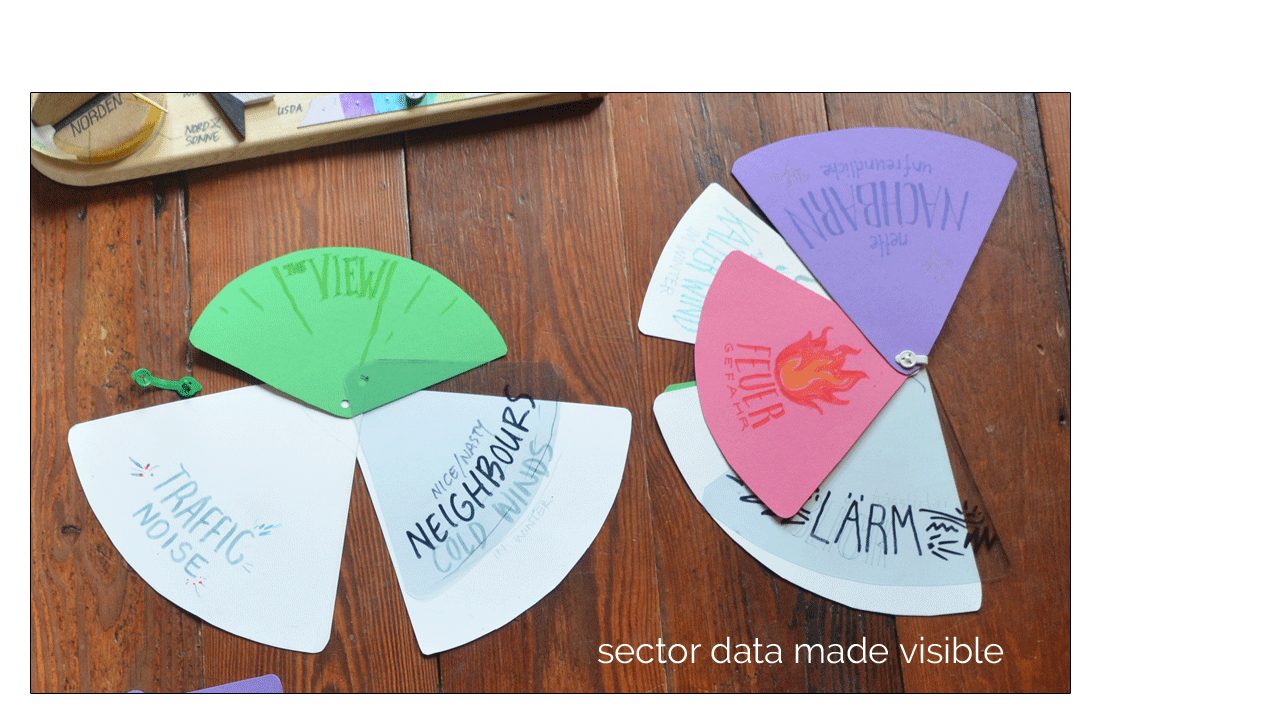
Analysemethoden aus der Permakultur wie die Sektorierung eröffnen weitere Perspektiven auf die gesammelten Daten. So lassen sich Einflüsse darstellen, die von außen auf die Fläche wirken: Sonnenverlauf über das Jahr, Wind, Lärm, Ein- und Ausblicke. In Wohnumgebungen ist außerdem die Zonierung sinnvoll, die eine Fläche nach Häufigkeit und Intensität der Nutzung unterteilt.
Grundkarte abbilden
- Die Grenzen der Fläche aus eigenen Plänen, öffentlichen Flurstückplänen oder Maßstabsplänen von Architekten entnehmen und die Fläche im Maßstab der ausgedruckten Scheiben darstellen (Voreinstellung 1:50). Wie bei gezeichneten Plänen ist die Maßstabsgenauigkeit wichtig, um die richtigen Pflanzabstände zu finden.
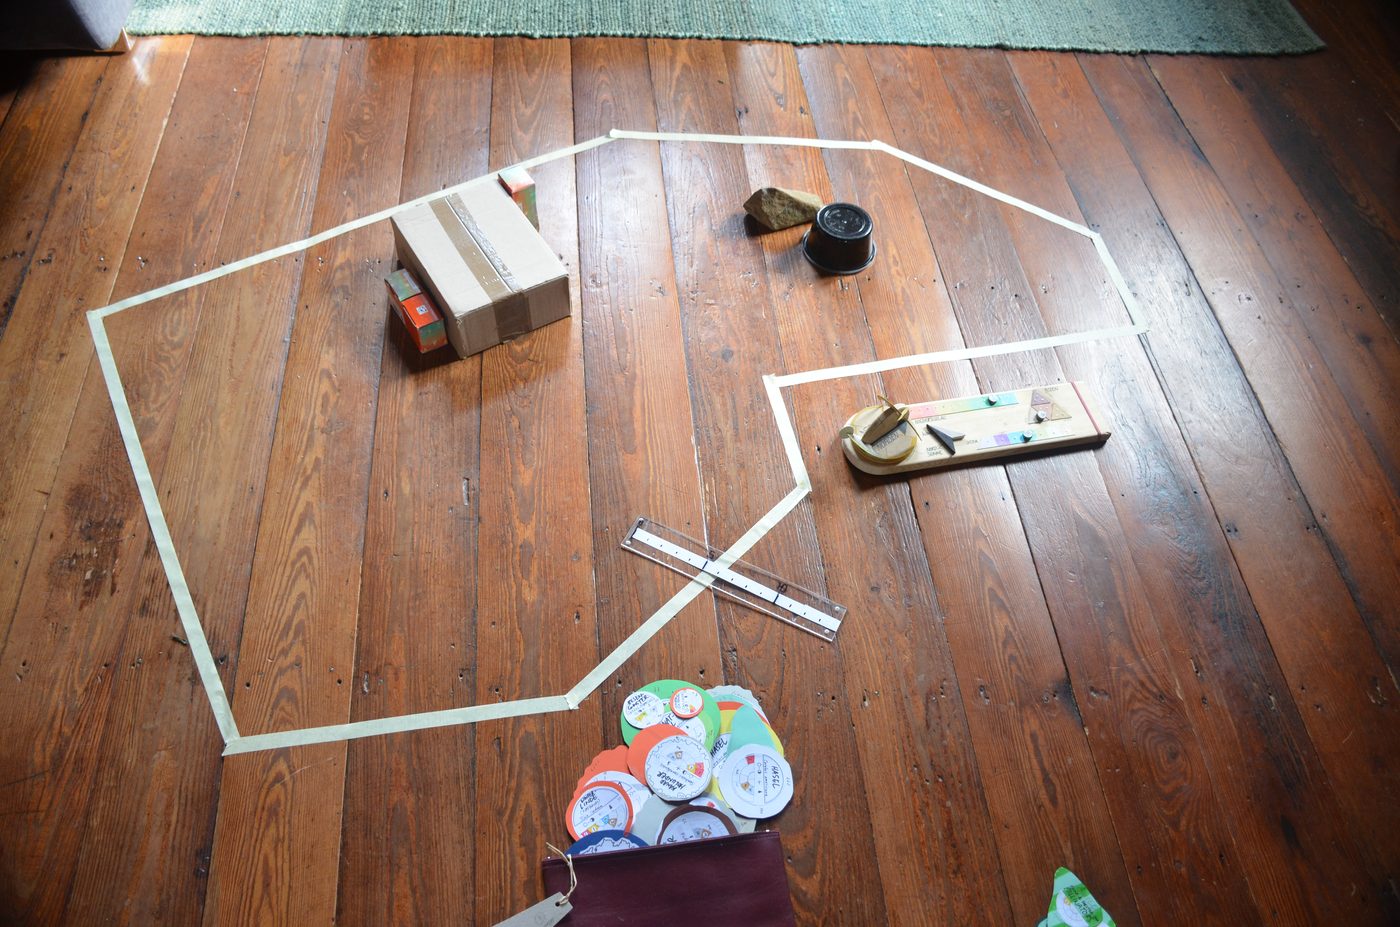
- Das geht auf viele Arten: im Sandkasten abstecken, mit Kreppband auf den Boden kleben, mit Kreide auf eine Wand oder große Unterlage zeichnen – Magnettafeln, Pinnwände, großformatige Poster, Möbelkartons oder Tapetenrollen.
- Umgebende Strukturen wie Gebäude und Hecken lassen sich mit Objekten darstellen, etwa Schachteln. Mit einer beweglichen Lichtquelle wird ihr Schatten greifbar.
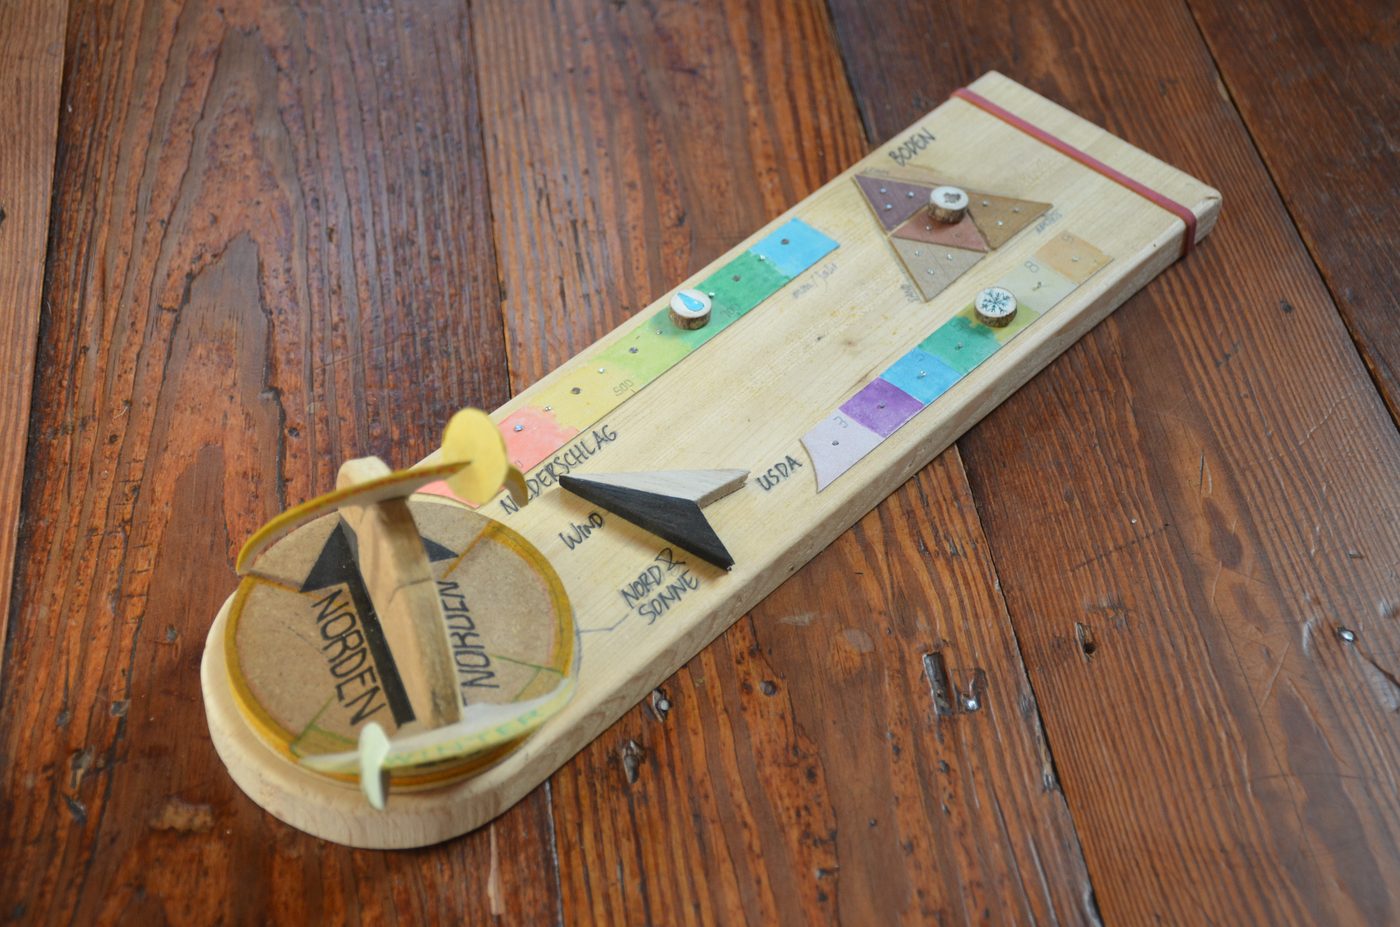
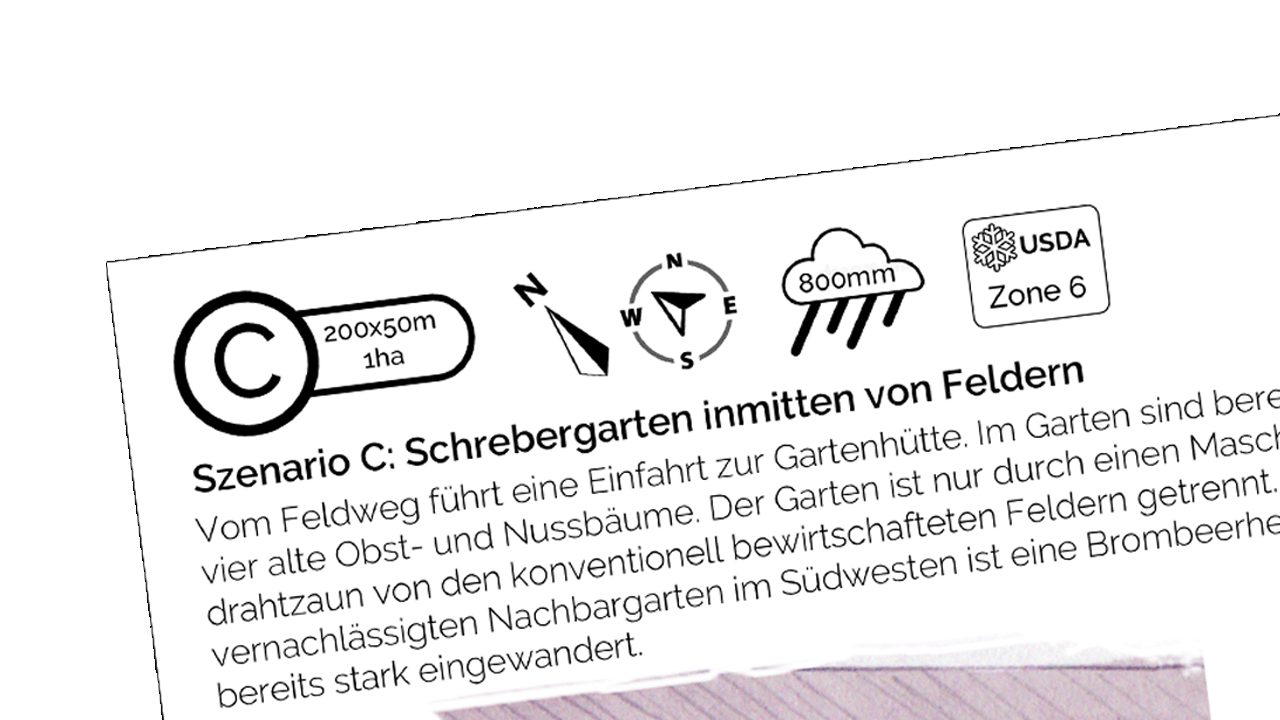
- Damit die Standortbedingungen immer präsent bleiben, werden die Ergebnisse der Analyse vereinfacht dargestellt – als Infoblatt oder wie hier als „Infoboard“.
Von der Pflanzenliste zum Set von Baumscheiben
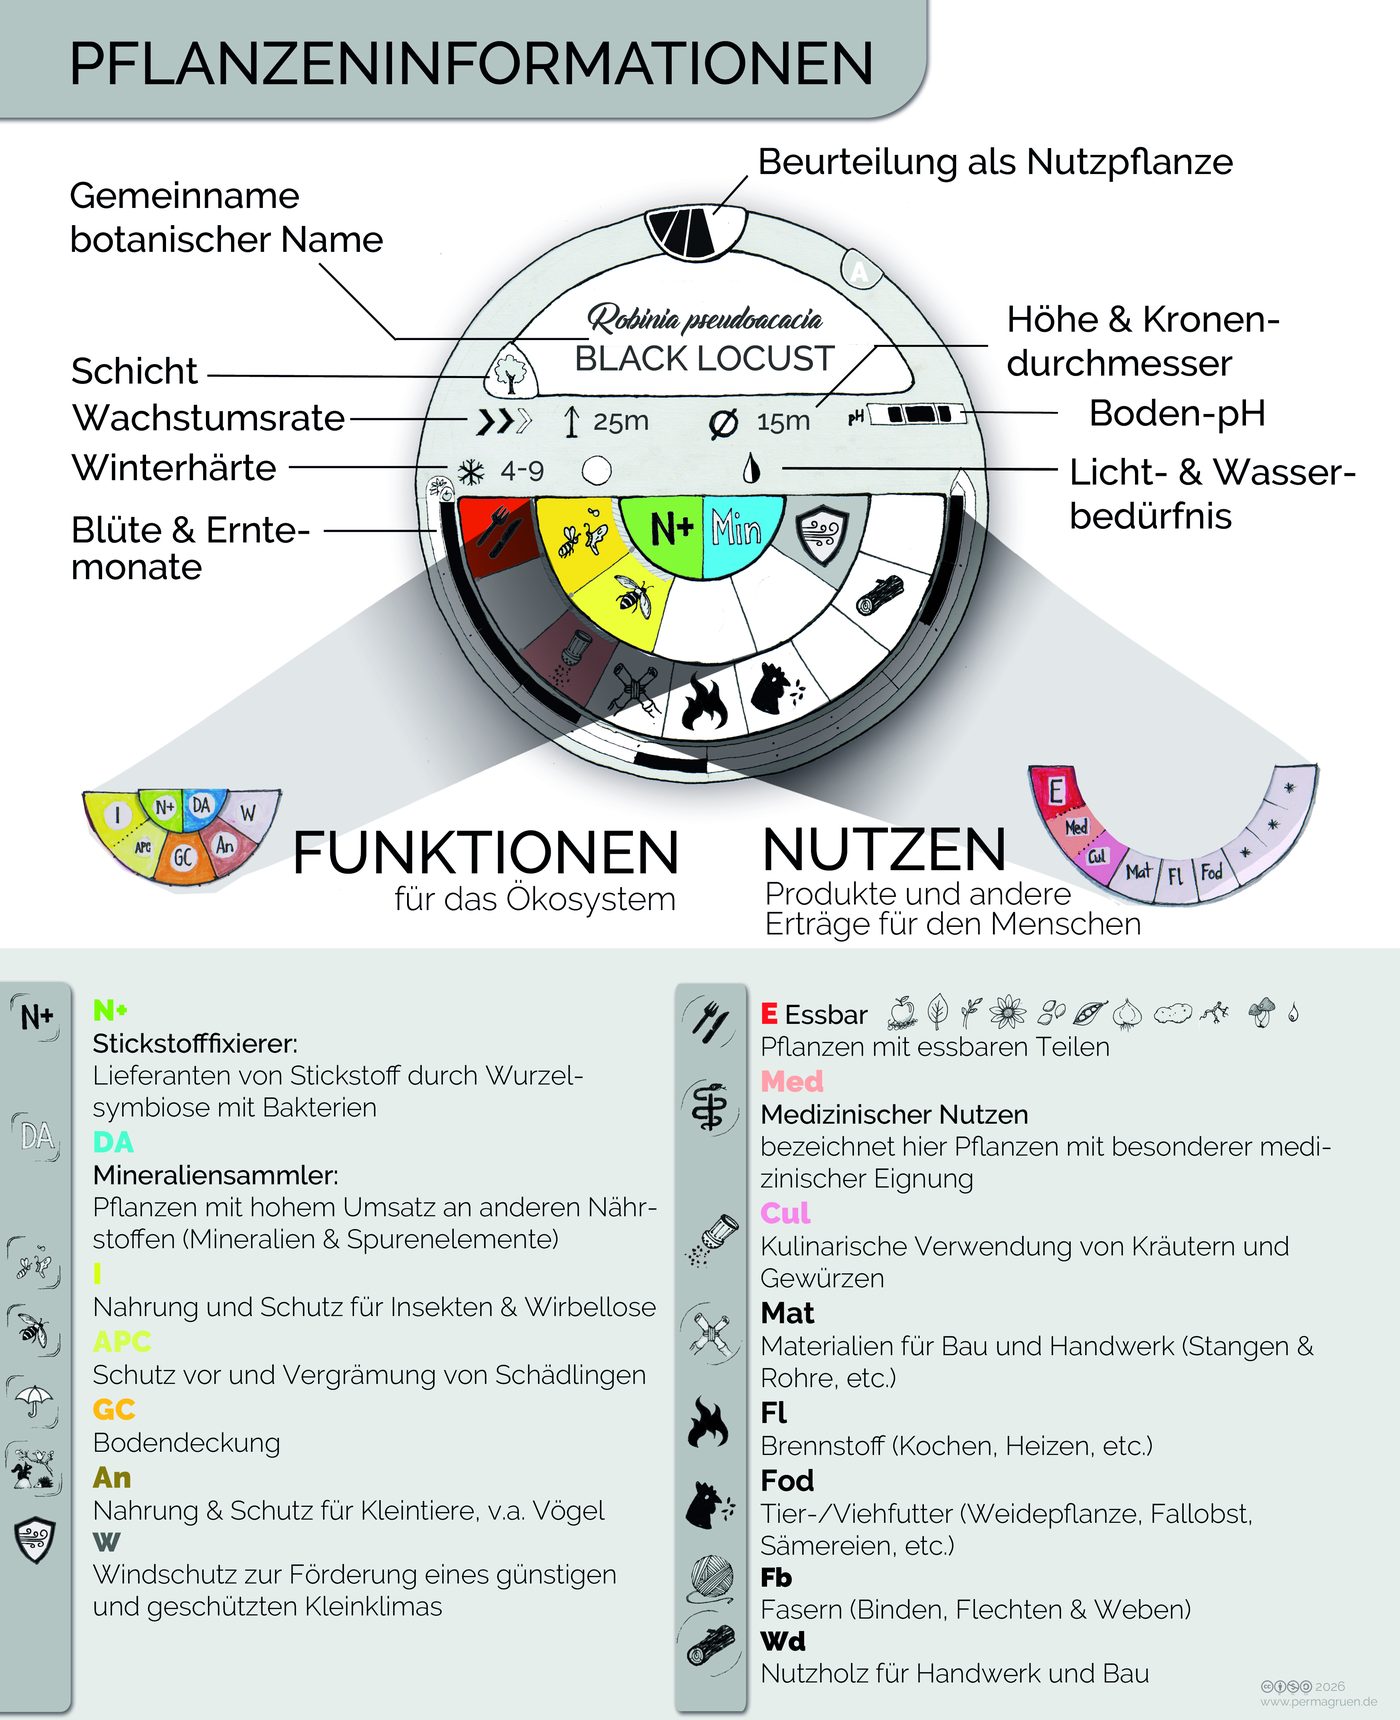
Alle Kartenansichten sollen die ökologische Nische einer Pflanze abbilden, damit die Platzierung auf der bestmöglichen Informationsgrundlage erfolgt. Die wichtigsten Informationen stehen auf der Vorderseite: Namen, Abmessungen, Anforderungen und Toleranzen, Nutzen und Funktionen. Die Rückseite bleibt frei für weitere Notizen.
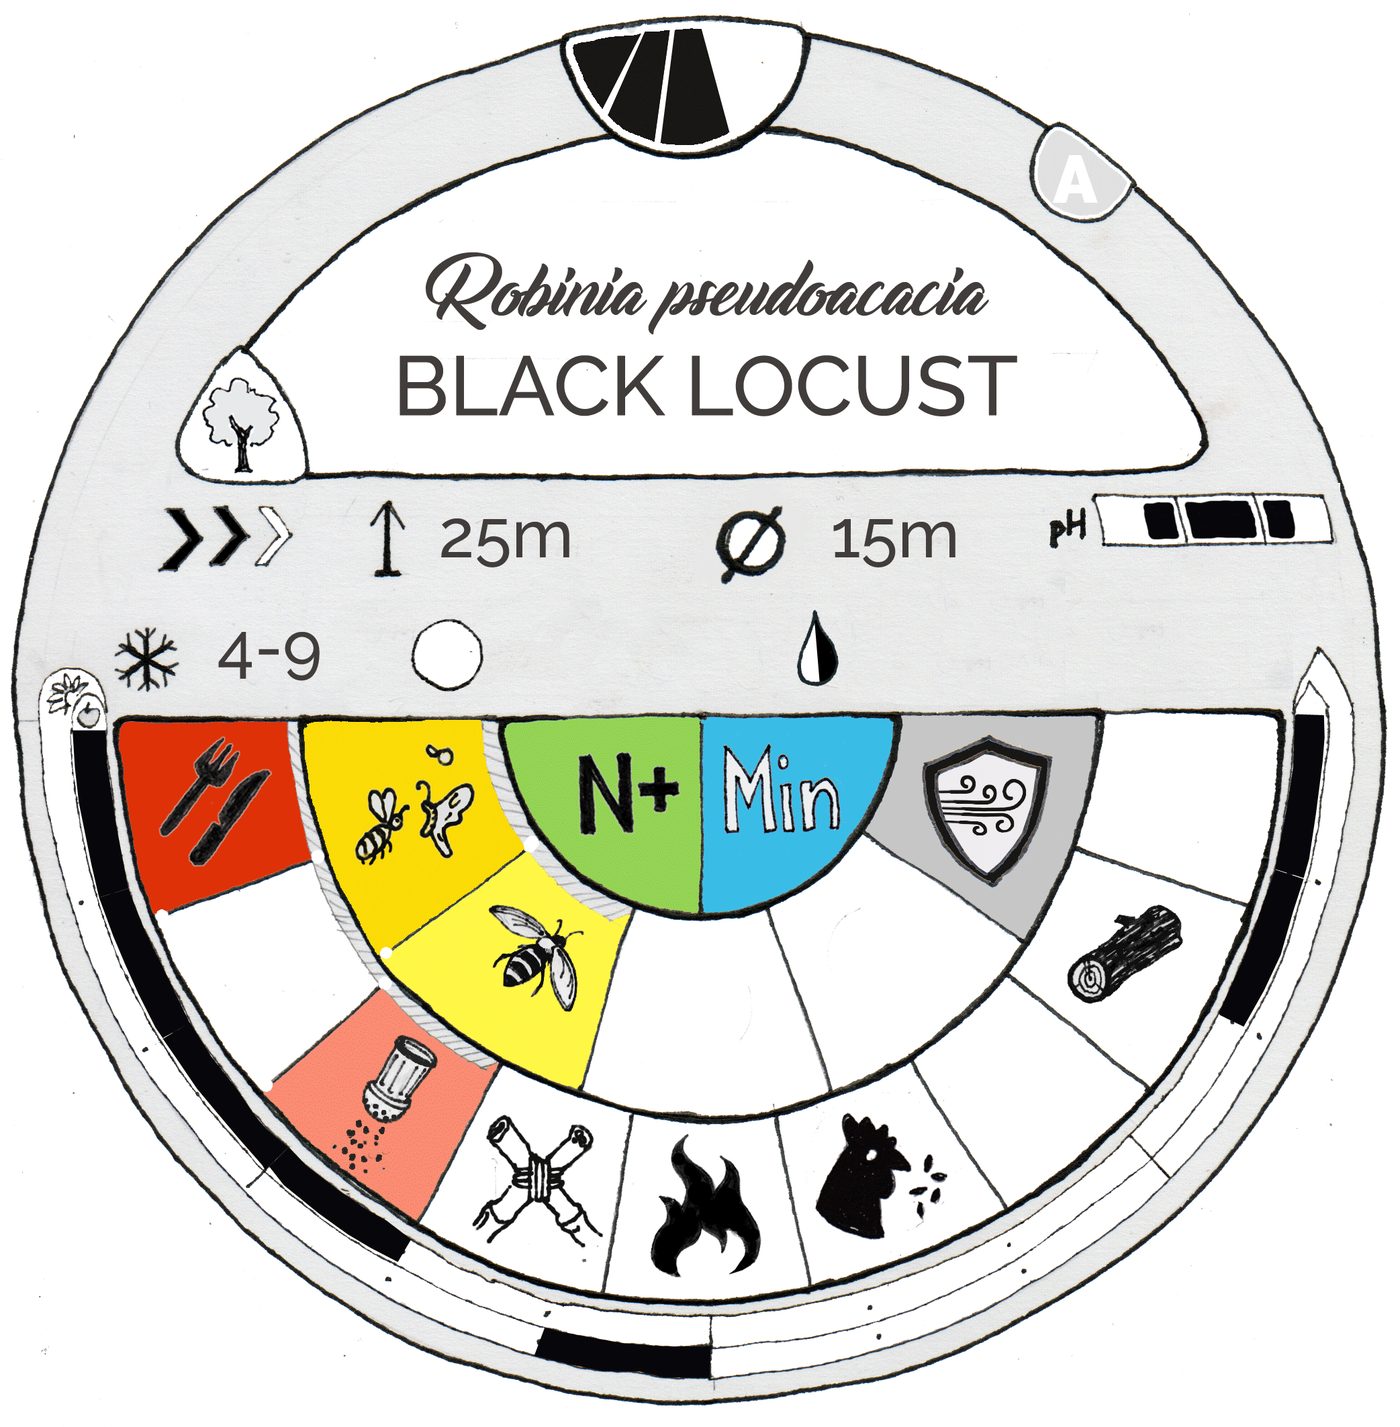
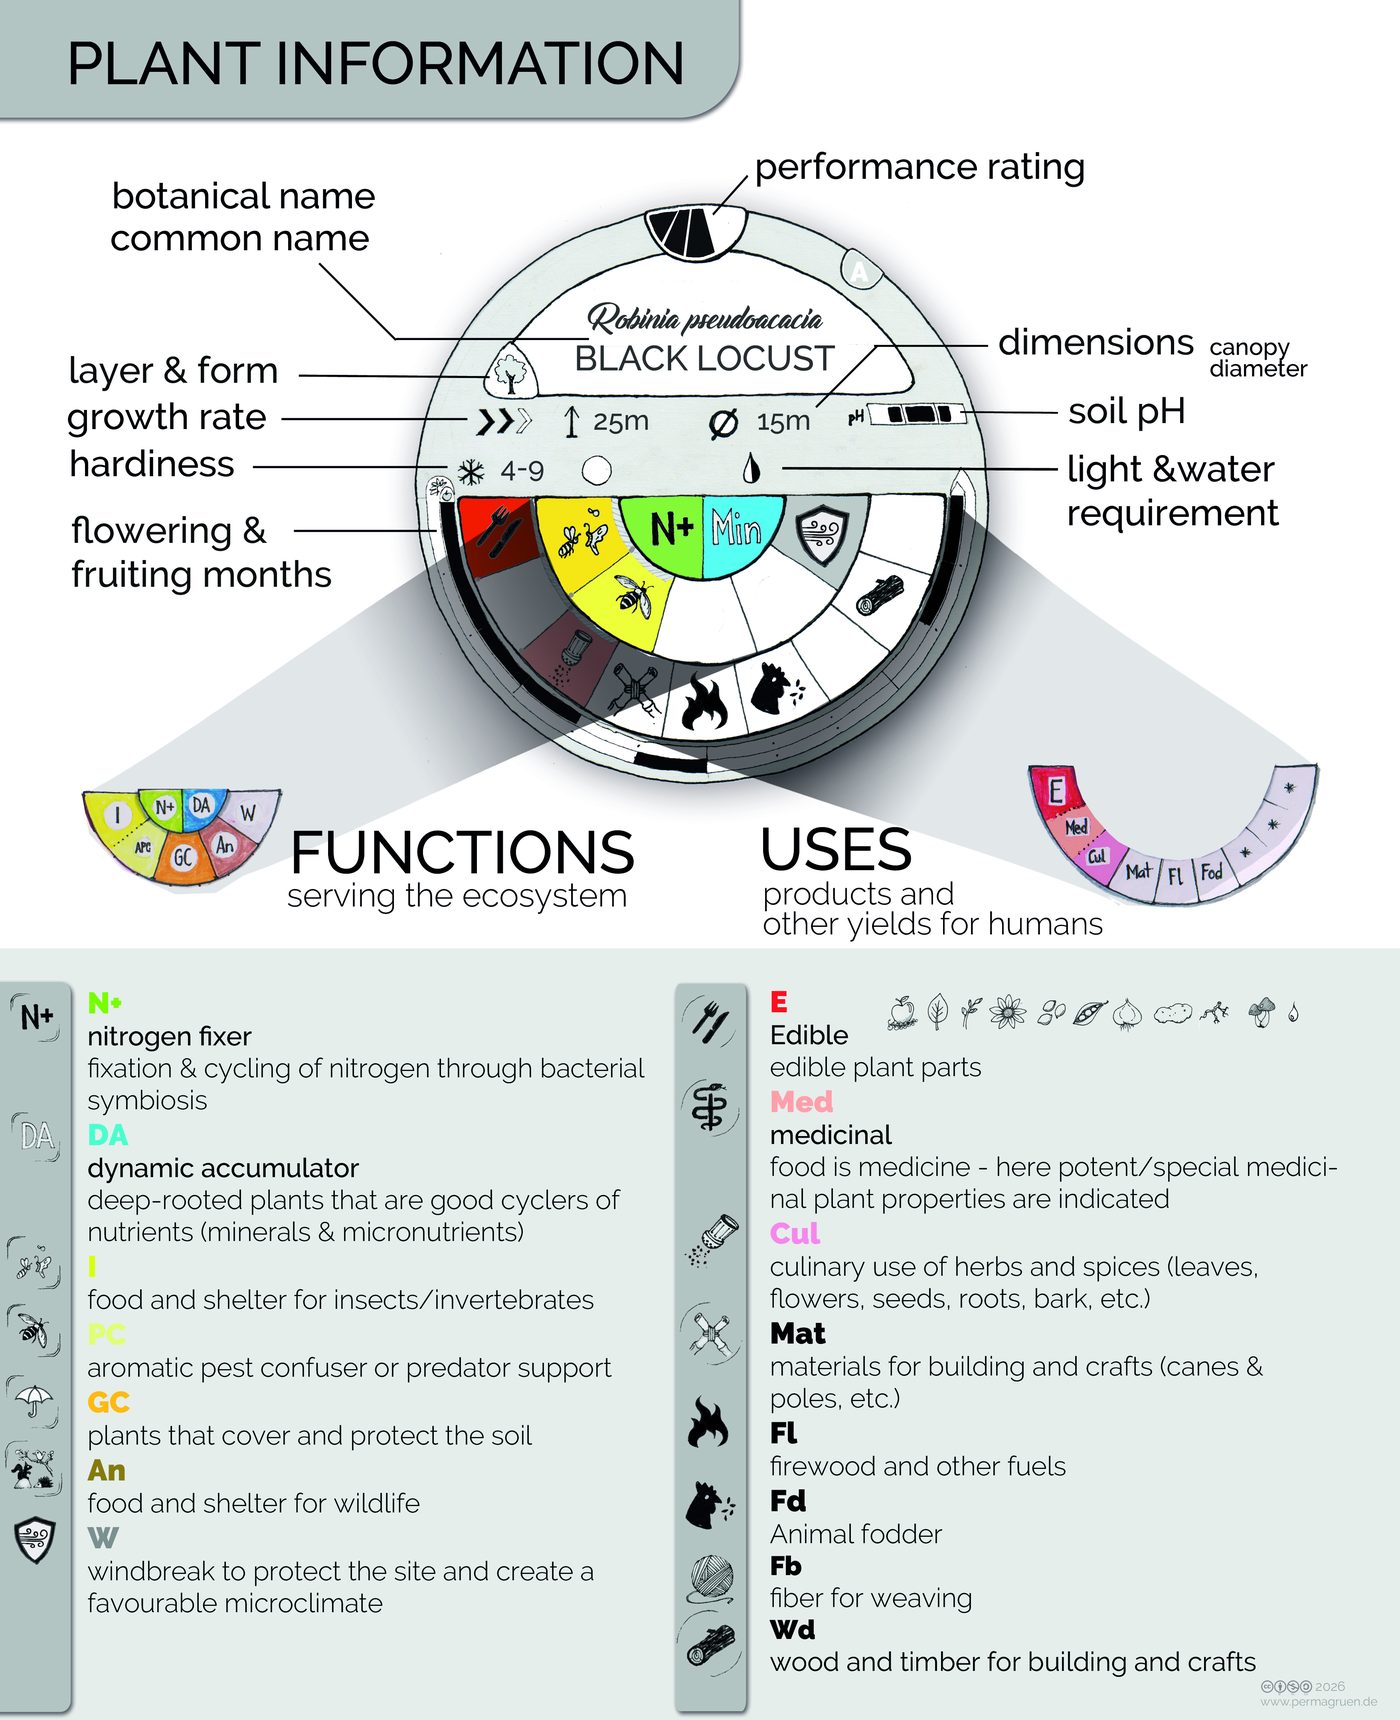
Die Baumscheibe im Detail
- Ganz oben
- Die Bewertung als Nutzpflanze, darunter im weißen Feld botanischer und deutscher Name. Das Symbol links zeigt die Schicht.
- Grauer Bereich
- Die für die Platzierung wichtigsten Eckdaten (siehe unten).
- Unterer Halbkreis
- Die beiden inneren Kreise zeigen die Funktionen im Ökosystem, der äußere die Erträge für Menschen, meist Produkte (siehe Platzieren der Pflanzen).
- Ringe
- Außen die Blütezeit, innen die Reife- und Erntezeit, jeweils gegen den Uhrzeigersinn von Januar bis Dezember.
Der graue Bereich
- Wachstum
- langsam – moderat – schnell wachsend
- Höhe
- maximale Höhe der ausgewachsenen Pflanze
- Kronendurchmesser
- Durchmesser der ausgewachsenen Gehölzkrone bzw. Ausbreitung bei Stauden
- Boden-pH
- sauer bis neutral, neutral, neutral bis basisch
- Winterhärte
- Zone nach USDA
- Licht
- Vorliebe der Pflanze (Optimum) von sonnig über halbschattig bis vollschattig
- Wasser
- Wasserbedarf, kombiniert mit der Durchlässigkeit bzw. Wasserhaltefähigkeit des Bodens (durchlässig, feucht, nass)
- Boden bald
- Sand – Schluff – Lehm – Mitte. Sind alle vier Symbole eingeblendet, eignet sich die Pflanze für alle Böden.
Das Set drucken
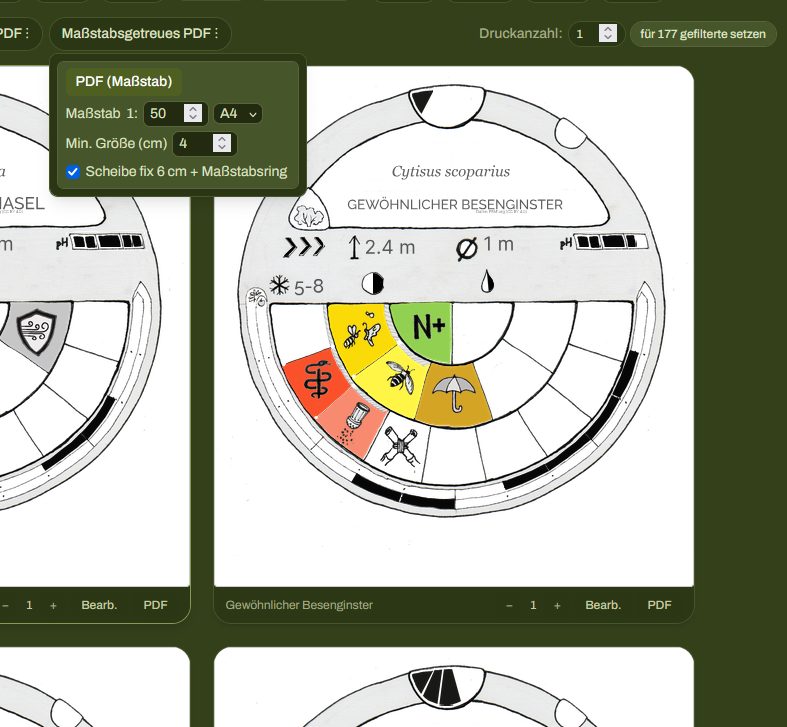
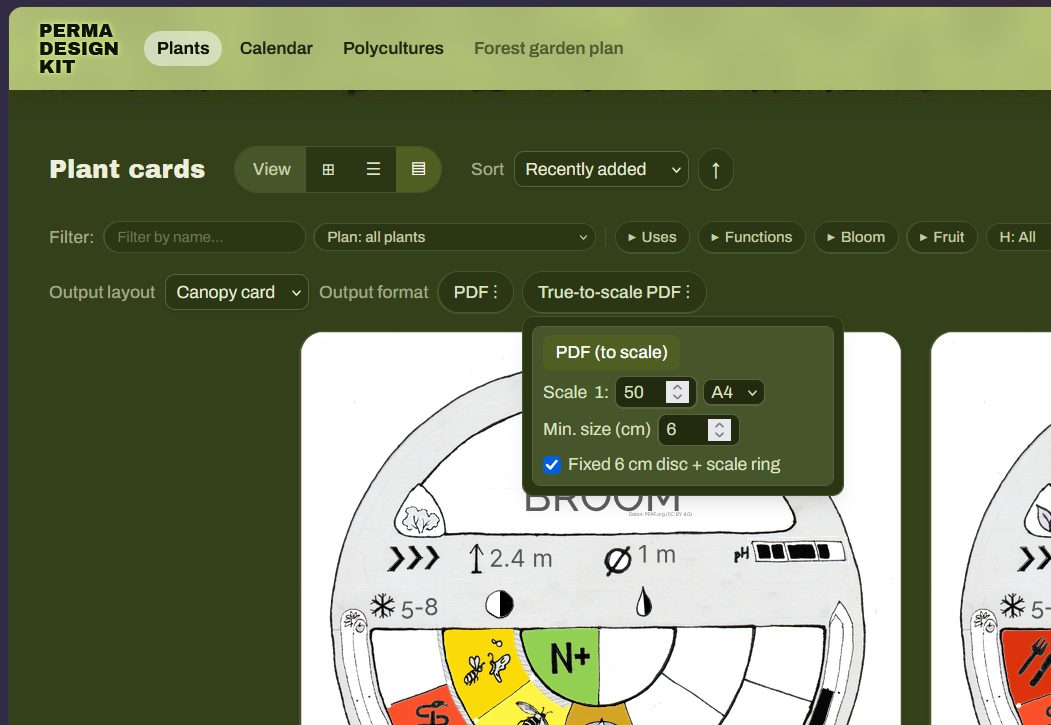
In der Kartenansicht unter Maßstabsgetreues PDF. Jede Scheibe bekommt die Kronenbreite im gewählten Maßstab, verteilt auf A4, A3 oder A2.
- Maßstab 1:50
- Voreingestellt. Bildet mittlere bis große Flächen ab, das Set bleibt handlich. 4 m Krone = 8 cm Scheibe.
- Min. Größe 4 cm
- Kleinere Scheiben werden nicht gedruckt, weil sie kaum lesbar wären. Das Programm sagt dir, welche fehlen.
- Fix 6 cm + Ring
- Jeder Infokreis ist 6 cm groß, der äußere Ring zeigt die echte Kronengröße.
Individuelle Anpassung
Drucke in Farbe oder Graustufen auf Papier oder Folie und schneide die Kreise aus. Es lohnt sich, die Ausdrucke auf die eigene Situation und die eigene Art der Wahrnehmung anzupassen: Farbiges Papier oder Ausmalen machen die Scheiben unterscheidbar, die Rückseite bietet Platz für weitere Informationen.
Vom Flächenentwurf zum fertigen Pflanzplan
Platzieren der Pflanzen
Wo genau eine Pflanze hinkommt, bestimmen vor allem die Standortbedingungen und die Eigenschaften der Pflanze. Deshalb sollten diese Informationen immer präsent sein.
Die Ergebnisse der Standortanalyse lassen sich am einfachsten auf einem Blatt mit den Eckdaten darstellen. Am anderen Ende der Skala steht ein „Infoboard“, das Nordung und Sonnenverlauf veranschaulicht und Niederschlag, Hauptwindrichtung, Winterhärtezone und Bodentyp zeigt. Licht ist in unseren Breiten der begrenzende Faktor für Systeme, die auf allen Ebenen produktiv sind – der Sonnenverlauf ist darum die wichtigste Information für die Position einzelner Pflanzen.
Die für die Platzierung wichtigen Eigenschaften der Pflanzen stehen auf den Baumscheiben. Ihre Funktionen sind farbig markiert, so dass die Grundbedingungen für eine Polykultur schnell ersichtlich sind – ein Polykultur-Design nach Farben:
Dokumentation
Beim analogen Set hält man Entwürfe am besten mit Fotos fest. Mit einer klaren, eingängigen Benennung der Bilddateien lassen sich die Ergebnisse gut ordnen. Wer die Entwürfe professioneller weiterbearbeiten möchte, überträgt sie in den digitalen Waldgartenplan, der ähnliche Möglichkeiten wie ein Geoinformationssystem (GIS) bietet.
Derzeitige Grenzen
Lesbarkeit der Baumscheiben
Beim Standardmaßstab 1:50 lassen sich nur Gehölze und ausreichend große Stauden (ab etwa 1 m Durchmesser) gut abbilden; bei kleineren Kreisen sind die Daten an der Grenze der Lesbarkeit. Eine Variante mit Kürzeln statt Symbolen ist im Test und kann hier helfen (Einstellungen → Ansicht → Kürzel statt Farbpunkte).
Die frühen Phasen der Umsetzung lassen sich im Standardmaßstab sehr gut abbilden: Meist werden zuerst Baum- und Strauchschicht gepflanzt, die krautigen Schichten folgen erfahrungsgemäß in den Folgejahren.
Abbildung von Gilden
Ob alle Ökosystemfunktionen für alle Pflanzen abgedeckt sind, lässt sich bisher nur begrenzt beurteilen. Für einzelne Polykulturen gibt es eine vorläufige Lösung: unförmig ausgeschnittene Flächen, die Gruppen krautiger Pflanzen darstellen. Deren Informationen lassen sich außerhalb des Plans zeigen, etwa mit der Streifenansicht.
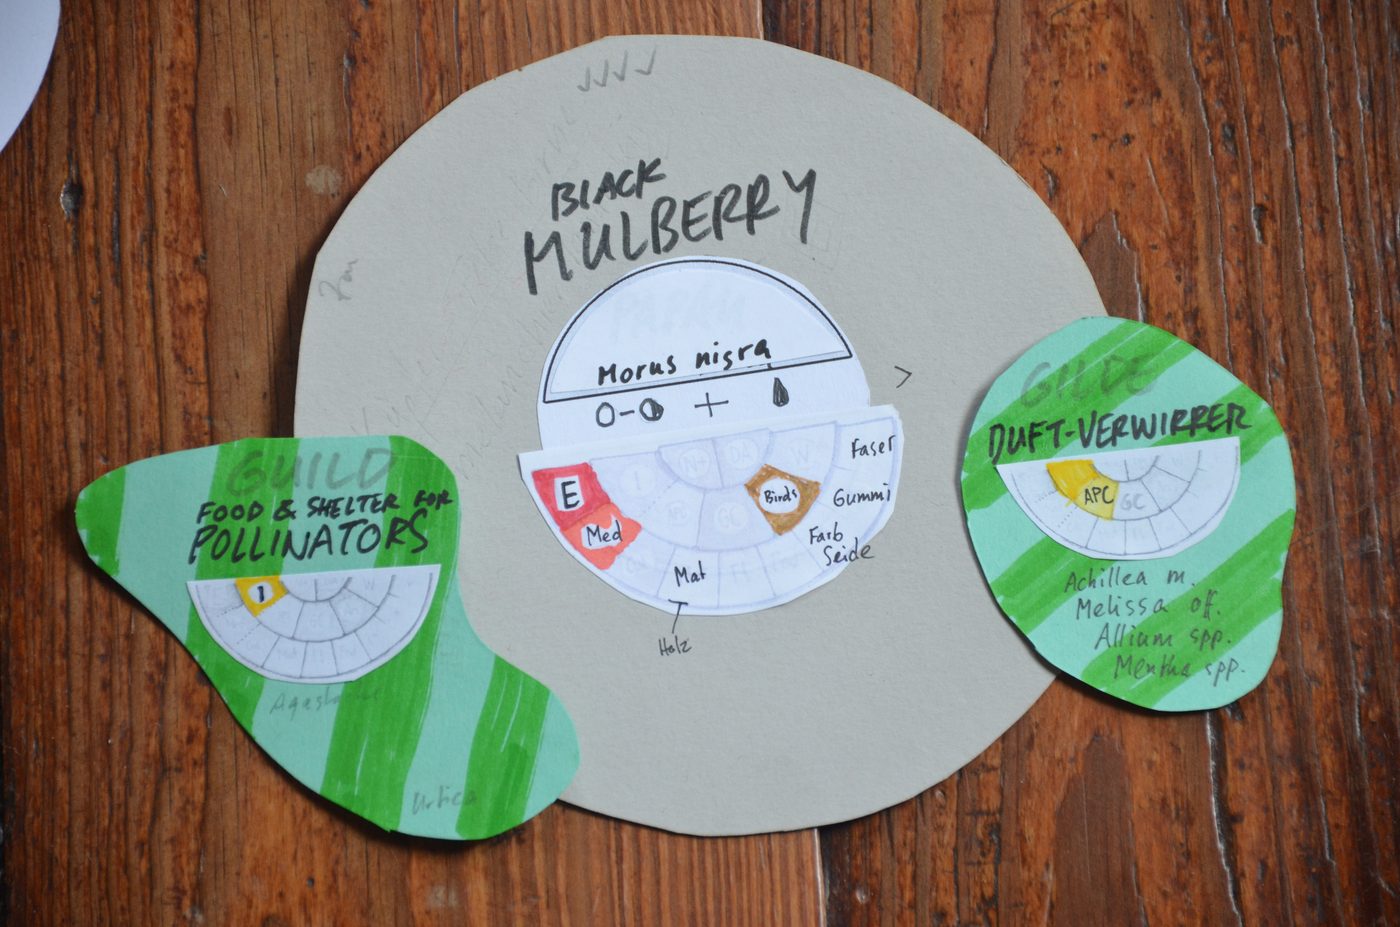
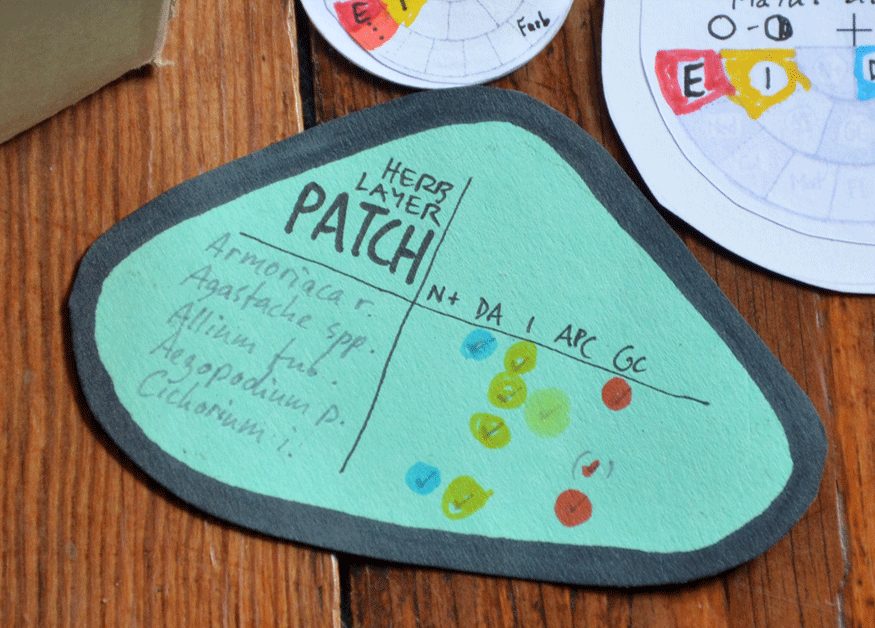
Eine Gilde ist allerdings nicht dasselbe wie eine Polykultur, denn ihre Mitglieder sind nicht auf eine Teilfläche beschränkt. Die Bestäubergilde etwa besteht meist aus Blühpflanzen, die über den ganzen Waldgarten verteilt sind. Diese Komplexität versuchen wir vorerst in den digitalen Funktionen Polykulturen und Waldgartenplan abzudecken (siehe Polykulturen & Gilden).
4Die Software: permadesignkit.orgPflanzen, Kalender, Polykulturen, Waldgartenplan, Daten sichern, Tastenkürzel, Ausblick
Über das physische Set aus Baumscheiben hinaus bietet die Software wirkungsvolle Werkzeuge, vor allem für die Designphase eines Designprozesses.
Technisches
Das Perma Design Kit läuft im Browser. Es sammelt Daten aus öffentlichen Datenbanken (vor allem PFAF und Wikidata) und bereitet sie für verschiedene Ansichten auf. Alle importierten Daten und eigenen Eingaben werden nur im Browser gespeichert und verlassen den Computer nicht – bis der Speicher des Browsers gelöscht wird. Wie du sie sicherst, steht unter Daten sichern, teilen, offline nutzen.
Das Tool sollte in allen gängigen Browsern und auf mobilen Geräten funktionieren. Wenn nicht: bitte Fehler melden.
Aufbau & Bedienung
Beim ersten Aufruf erscheint ein Rundgang, der die Grundzüge des Tools erklärt. Oben im Menü findest du die Seiten:
- Pflanzen
- Sammlung und grafische Aufbereitung der Nischendaten in verschiedenen Ansichten
- Kalender
- Blüh- und Erntekalender
- Polykulturen
- funktionale Pflanzengemeinschaften zusammenstellen
- Waldgartenplan
- Flächenplanung mit einer Pflanzenliste am realen Standort (in Entwicklung)
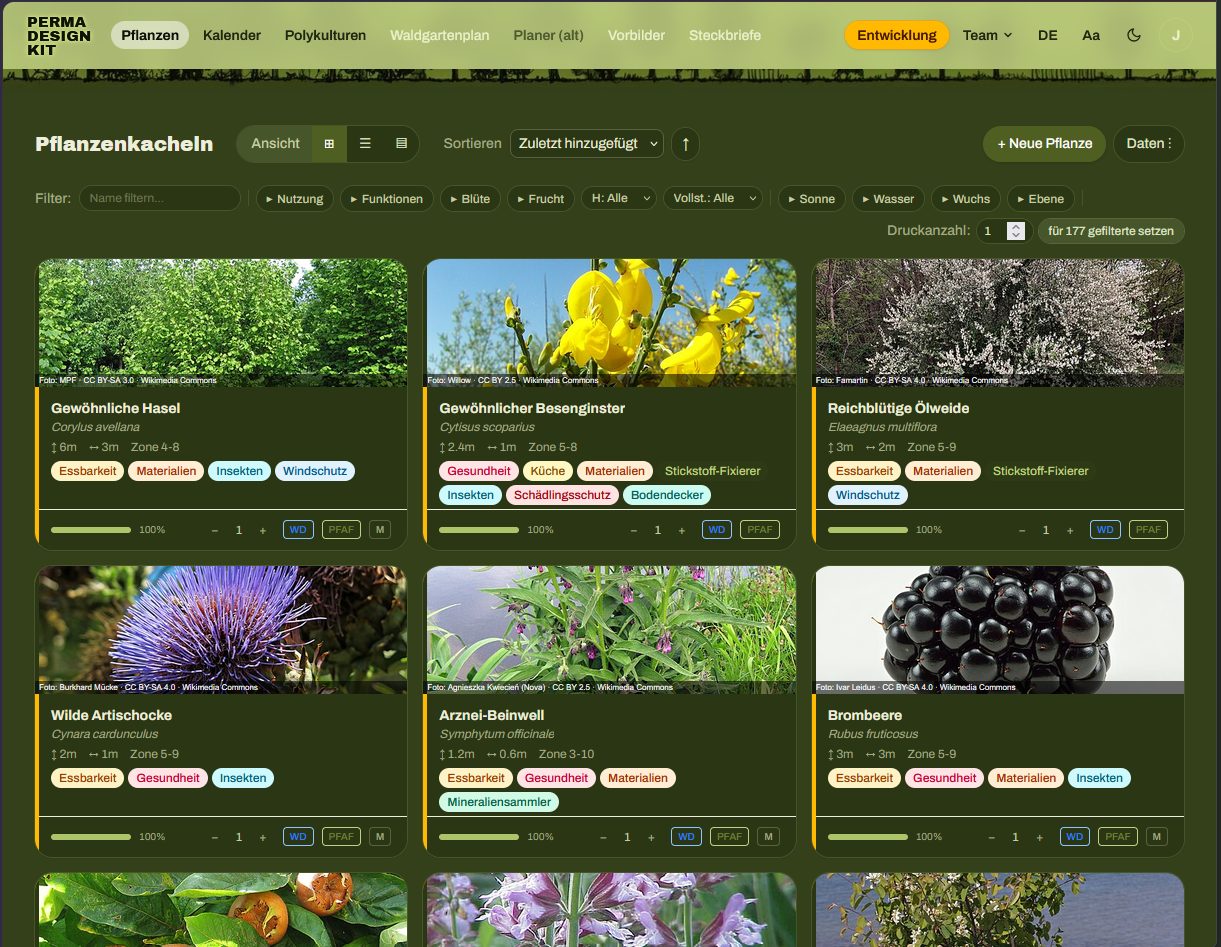
Pflanzen
Das grundlegende Werkzeug der Anwendung: die gesammelten Daten zur ökologischen Nische der Pflanzen, filter- und sortierbar in verschiedenen Ansichten.
a) Eine Pflanzenliste neu erstellen
- Pflanze hinzufügen. Über das Suchfeld findest du Pflanzen aus den Quellen. Die Zahl der Exemplare stellst du direkt dort ein. Mit
Neue Pflanzelegst du alles von Hand an. - Daten ergänzen lassen. Fehlende Angaben kommen aus PFAF, Edible Forest Gardens und Wikidata (siehe Datenquellen).
- Nachbessern und bearbeiten. Im Bearbeiten-Dialog jeden Wert ändern. Das Quellen-Kürzel springt dann auf M für manuell, und dieser Wert wird nie überschrieben.
Es ist wichtig, die Pflanzendaten an die eigene Situation anzupassen: Eigene Größenangaben braucht es für Sorten, verschiedene Unterlagen oder ältere Bestandsgehölze. Das gilt auch, wenn die Größe von der Bewirtschaftung abhängt, etwa bei Bäumen im Niederwald (Linde für Salat, Hasel für Stecken, Weide für Korbmaterial). Sorten haben außerdem oft andere Blüte- und Reifezeiten.
b) Vorhandene Listen verwenden
Fertige Pflanzenlisten liest du als CSV oder JSON über das Menü Daten ein. Dort liegt als Beispiel die Liste „Pflanzen für kleine Gärten“ (42 Arten). Tabellen aus Excel exportierst du als CSV und importierst sie hier.
Ansichten
In allen Ansichten gibt es den Knopf Daten: Daten vervollständigen, Listen importieren und exportieren, Druckansichten erzeugen. Die Filterzeile sortiert und filtert die Pflanzen.

- Kacheln
- Sortier- und filterbare Übersicht mit Bild, Akzentstreifen nach Hauptnutzung und Vollständigkeitsbalken.
- Liste
- Sortier- und filterbare Tabelle. Mehrere Pflanzen auswählen und gemeinsam ergänzen, löschen, exportieren oder drucken.
- Baumscheiben
- Eine weitere Ansicht neben den Kacheln. Über die Druckknöpfe entstehen die maßstabsgetreuen Baumscheiben als PDF.
Zeichen in der Pflanzenliste
- Ausgefüllte Badges: Nutzung der Pflanze (essbar, medizinisch, Material …).
- Umrandete Chips: Herkunft eines Werts, zum Beispiel PFAF.
- Akzentstreifen links: Hauptnutzung in dieser Reihenfolge:essbar/KücheHeilpflanzeStickstofffixiererBodendeckerInsektenpflanze
- Vollständigkeit der Daten: grün ab 80 %, gelb ab 50 %, darunter rot.
Bearbeiten
Jede Pflanze öffnest du über den Stift-Knopf zum Bearbeiten, um fehlende Daten zu ergänzen und die Angaben an deinen Garten anzupassen.
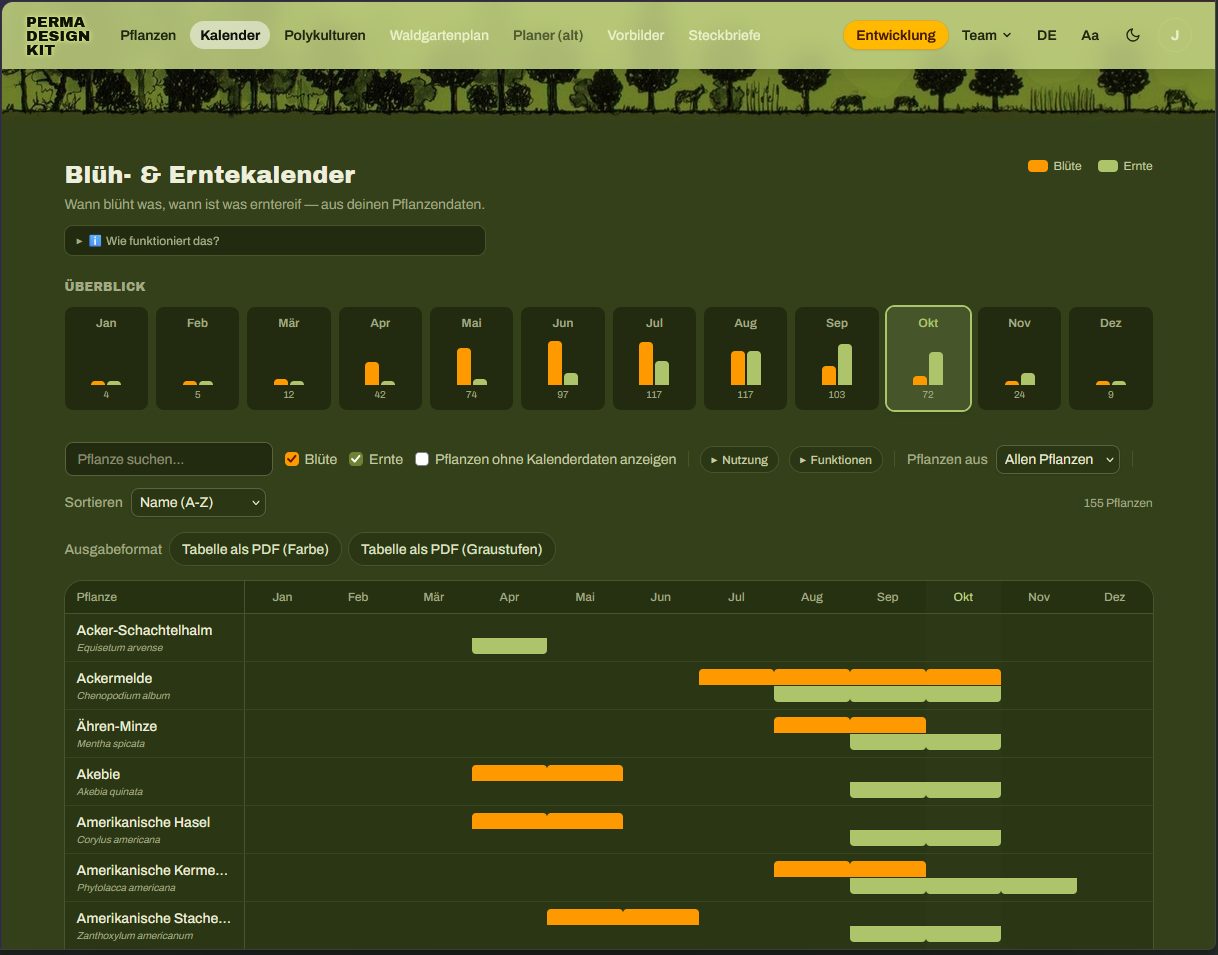
Kalender
Blüte- und Erntezeiträume als Kalender, sortierbar und als PDF druckbar.
Polykulturen
Dieses Werkzeug schlägt Pflanzpartner vor, die ähnliche Ansprüche und Toleranzen bei Licht, Wasser und Boden-pH haben. Gespeicherte Polykulturen lassen sich als Verbund in den Waldgartenplan einfügen. erster Entwurf, in Entwicklung
Polykulturen erstellen
- Eine Ankerart wählen, oft ein zentrales Element wie ein Obstbaum.
- Mitglieder hinzufügen und dabei jede Rolle mindestens doppelt besetzen: Begleiter, Bodendecker, Stickstofffixierer, Mineraliensammler, Insekten- oder Duftpflanze, Obst oder Beere (siehe Designprinzipien für Polykulturen).
- Das Vorschlags-Panel rechts zeigt passende Pflanzen aus deiner Liste und weitere Vorschläge – je höher die Zahl, desto besser passen Licht, Wasser und pH.
- Speichern.
Alternativ legst du im Bearbeiten-Dialog einer Pflanze eine Gruppe an und machst daraus über Aus Gruppe anlegen eine Polykultur. Fertige Beispiel-Polykulturen findest du im Menü der Seite und in den Quellen.
Waldgartenplan
Die digitale Alternative zum Baumscheiben-Set. Hier gibt es noch den meisten Entwicklungsbedarf: Ein digitales Werkzeug muss letztlich komplex genug für professionelle Planungen und mit GIS-Anwendungen verträglich sein.
Wir tüfteln gerade einiges aus. Das Werkzeug hat schon viele neue Funktionen, die noch nicht öffentlich sind und getestet werden möchten, darunter:
- Baumbiographien und Aufgaben: für jeden Baum eine Zeitachse mit Bonitur, Ernte, Schnitt, Pflege und Fotos
- bessere Einbindung in (Q)GIS
- gemeinsam im Team an Plänen arbeiten und sie freigeben
- ein professioneller Waldgartenplaner mit Ebenen, Erntelücken-Analyse, Windschutz, Wasserablauf und mehr
Wenn du die neuen Funktionen im Beta-Test ausprobieren möchtest: Wir freuen uns über dein Feedback, deine Unterstützung und deinen Rat, wohin sich das Werkzeug entwickeln soll. Vielleicht hast du sogar Lust, mitzuwirken und Teil des Teams zu werden?
Oben rechts stellst du ein, wie umfangreich die Oberfläche ist. Einfach führt in drei Schritten durch den Plan und zeigt fünf Schichten zum Füllen – genug für die meisten Gärten. Klassisch zeigt alle Werkzeuge und bietet einen professionellen Funktionsumfang. Ein Wechsel ist jederzeit möglich und ändert nur die Oberfläche, nicht die Daten im Plan. Unabhängig davon lässt sich jeder Plan in 2D oder 3D ansehen.
Flächenplan anlegen und Pflanzen positionieren
+ Neuer Waldgartenplan, Adresse suchen oder Mein Standort wählen und die Eckpunkte der Fläche per Klick setzen. Flächengröße, Nordung und Gelände ergeben sich daraus. Ohne Standort gibt es ein einfaches Raster.- Fläche einzeichnen für Teilbereiche wie Beete, Teich und Wege.
- Pflanzen setzen: Pflanze wählen und auf die Fläche klicken – einzeln, als Reihe mit festem Abstand oder als ganze Polykultur (Polykultur als Paket setzt Anker und Mitglieder auf einmal).
- Pflanzen per Ziehen verschieben, mit dem Lasso mehrere zugleich markieren. Ziehen auf freier Fläche verschiebt die Karte.
- Der Regler Jahre seit Projektbeginn (0–80) zeigt die geschätzte Kronengröße im jeweiligen Jahr. Schnell wachsende Pflanzen sind nach etwa 6, mittlere nach 15, langsame nach 30 Jahren ausgewachsen. Wuchsform und Habitus sind bisher einfach standardisiert dargestellt.
Karte, Luftbild, Gelände
Der Hintergrund kommt aus öffentlichen Daten: OpenStreetMap, amtliche Luftbilder (8–40 cm, in 13 Bundesländern, Österreich, der Schweiz und den Niederlanden) oder ein grobes Satellitenbild. Das Gelände stammt, wo verfügbar, aus amtlichen 1-m-Modellen. Gebäude im Umkreis von etwa 150 m stehen in 3D und werfen Schatten.
Auswertungen
- Funktionen
- Effektive Gilden für das Gesamtsystem: wo die sieben Ökosystemfunktionen wirken und wo sie fehlen, mit Vorschlägen aus deinem Bestand und Hier pflanzen.
- Besonnung
- Sonnenstunden pro Tag mit Schatten von Baumkronen, Gelände und Gebäuden: Sonne ab 6 h, Halbschatten 3–6 h, Schatten unter 3 h.
- Hinweise
- (experimentell) Mögliche Konflikte durch zu eng stehende Pflanzen derselben Schicht und ungedeckten Lichtbedarf, jeweils für ausgewachsene Pflanzen.
Werkzeuge und Ausgaben
- verschiedene Auswahlmodi
- Messen
- Bild speichern
- Flächen und Umrisse zeichnen
- GPS-Daten
- Pflanzliste mit Stückzahl und Preisen (CSV, PDF)
- Kalender nur für diesen Plan
- PDF-Export
- GeoJSON für QGIS
- Teilen-Link
Daten sichern, teilen, offline nutzen
- Backup
Einstellungen → Daten: alle Daten als JSON-Datei speichern, auch zum Umzug auf ein anderes Gerät. Automatisch per WebDAV oder Gist möglich.- Export
- Alle oder ausgewählte Pflanzen als CSV oder JSON.
- Teilen-Link
- Pflanzen, Polykulturen und Pläne stecken komprimiert im Link. Auf dem Server wird nichts gespeichert.
- App installieren
- Android/Chrome: Hinweis „App installieren“. iOS: Teilen-Symbol → „Zum Home-Bildschirm“. Nach dem ersten Besuch läuft alles offline, außer Suche, Datenquellen und Karte.
Tastenkürzel
| / | Suche fokussieren |
| Esc | Offenen Dialog schließen |
| f | Liste nach Namen filtern |
| n | Neue Pflanze |
| g l c | Ansicht wechseln: Kacheln, Liste, Karten |
| Shift + Klick | Bereich in der Liste auswählen |
| Alt + 1…9 | Menüpunkte der Reihe nach |
| ? | Alle Kürzel der aktuellen Seite |
Im Waldgartenplan: 2/3 für 2D/3D, H V L M für Bewegen, Markieren, Lasso, Messen, F R U für Fläche, Reihe, Umriss, I/O für die Jahre, J/K für die Sonne.
Ausblick & Mitmachen
Geplante Weiterentwicklung
Viele weitere Funktionen sind angedacht oder schon im Test:
- Pflanzenlisten nach Designziel: Ertragssystem zur Nahrungserzeugung, komplexe Agroforstsysteme, Anbau für die Gesundheit und mehr
- Darstellung verschiedener Sukzessionsphasen im Plan
- Polykulturen und Gilden: selbst festlegen, nach welchen Kriterien Pflanzen vorgeschlagen werden, und Gilden räumlich abbilden
- austauschbare Nutzen und Funktionen
- Vektordateien, um Baumscheiben aus Holz, MDF oder Kunststoff zu lasern
Mitmachen & Fördern
- Das Werkzeug nutzen und Feedback geben, Fehler über Fehler melden mitteilen
- Pflanzenlisten und Polykulturen zum Teilen erstellen
- Konzeption und Code auf GitHub beitragen
- Server- und Domainkosten über Unterstützen mittragen
- Unveröffentlichte Funktionen im Beta-Test ausprobieren
5Fachlicher HintergrundDesignprozess, Waldgärten, Polykulturen & Gilden
Für die meisten Menschen funktioniert das Werkzeug in vereinfachter Form am besten. Es ist aber viel weiter gedacht und erlaubt deutlich mehr Detail und Anpassung, so dass auch fachliche Planungen möglich sind. Hier geben wir nur eine kurze fachliche Einordnung; zur Vertiefung stehen unten die Quellen.
Ganz allgemein möchten wir die Frage beantworten, wie sich unsere Landnutzung im Einklang mit der Natur gestalten lässt. Dazu nutzen wir vor allem Wissen aus der Ökologie und den Naturwissenschaften, angewandt im Sinne der Ethik und der Designprinzipien der Permakultur. Am wichtigsten ist dabei, die Natur zu beobachten und nachzuahmen – von ihr lernen wir, zu „gärtnern wie der Wald“.
Designprozess
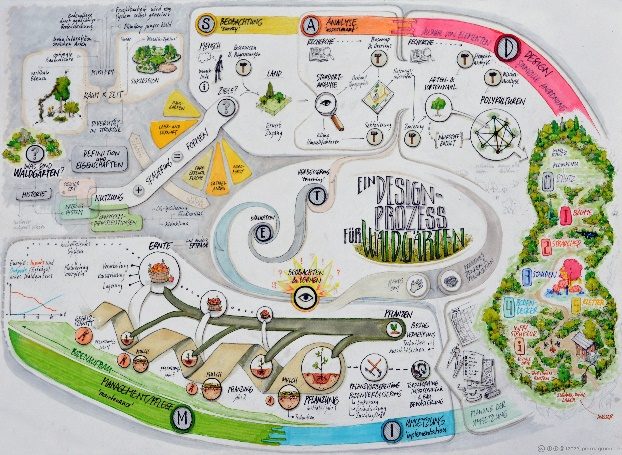
Gutes Design gelingt am ehesten, wenn man sich an einem Designprozess orientiert. Diese logische Abfolge von Phasen stellt sicher, dass wir möglichst viel über den Standort wissen, bevor das eigentliche Flächendesign beginnt. Je fundierter das Flächendesign, desto erfolg- und ertragreicher die Umsetzung. Und je länger wir uns von diesem Prozess leiten lassen, desto besser wird das Design durch wiederholte Schleifen von Beurteilung und Verbesserung.
Waldgärten
Anders als der Intensivanbau einjähriger Pflanzen verlangen mehrschichtige, permanente Systeme ein komplexeres, ganzheitlicheres Denken. Schon räumlich gehen wir vom fast zweidimensionalen Gemüsebeet in die dritte Dimension. Der größte Unterschied ist aber die vierte Dimension, die Zeit. Wälder sind die effizientesten Ökosysteme, die wir schaffen und prägen können, darum ist meist das Klimaxstadium der natürlichen Sukzession unser Ziel. Was in natürlichem Tempo ein Jahrtausend dauern kann, lässt sich durch ökologisch informierte Eingriffe deutlich beschleunigen.
Dazu hilft es sehr, die Zeit im Kopf „vorzuspulen“ und sich spätere Stufen der Sukzession vorzustellen – also in Weltzeit statt in Menschenzeit zu denken. Mit etwas Übung bildet sich ein sukzessionales Vorstellungsvermögen, das die zeitliche Perspektive öffnet und bessere Entscheidungen über die Position von Bäumen und Sträuchern erlaubt. Im Waldgartenplan hilft dabei der Jahre-Regler.
Beim Flächendesign von Waldgärten und komplexen Agroforstsystemen gehen wir von den etablierten Standardwerken aus: „Einen Waldgarten erschaffen“ von Martin Crawford und den zwei Bänden „Edible Forest Gardens“ von Dave Jacke und Eric Toensmeier (siehe Quellen).
Polykulturen & Gilden
Grob vereinfacht ist ein Waldgarten eine Ansammlung von Polykulturen: Meist teilen die Wege die Fläche in begrenzte Teilflächen (patches), auf denen mehrschichtige Pflanzengemeinschaften wachsen. Idealerweise decken sie die Ökosystemfunktionen ab, die für ihren Erfolg nötig sind – und der misst sich an den Erträgen, für die sie gestaltet sind. Ein Obstbaum hat in einer Lebensgemeinschaft am wenigsten Stress, weil sie ihn mit Bestäubung, Schädlingskontrolle, Nährstoffen und Bodendeckung unterstützt und schützt.
Kennt man die ökologischen Nischen der Pflanzen, lassen sie sich vor dem Hintergrund der Standortfaktoren so anordnen, dass sie die gewünschten Erträge liefern.
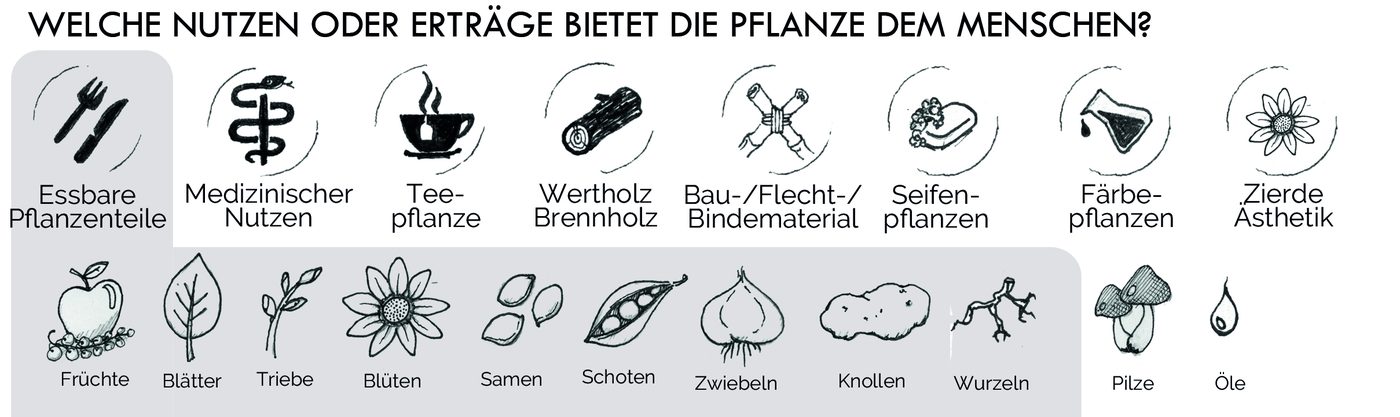
Die Gestaltung erfolgreicher Polykulturen folgt diesen Designprinzipien:
- Beziehungsbildende Platzierung
- Elemente so zueinander positionieren, dass Konkurrenz gering und Kooperation begünstigt wird.
- Stapeln von Funktionen
- Jedes Element erfüllt möglichst viele Funktionen und baut so viele Wechselbeziehungen auf.
- Redundanz
- Jede Funktion wird von mehreren Elementen erfüllt, damit sie für die Polykultur sicher gewährleistet ist.
Darüber hinaus hilft es immer, Prinzipien der Permakultur mitzudenken: Design vom Muster zum Detail, Vielfalt nutzen und fördern, integrieren statt trennen (siehe Holmgren in den Quellen).
Neben den Nutzen für uns sollen Polykulturen zugleich wichtige Funktionen für das Ökosystem erfüllen.
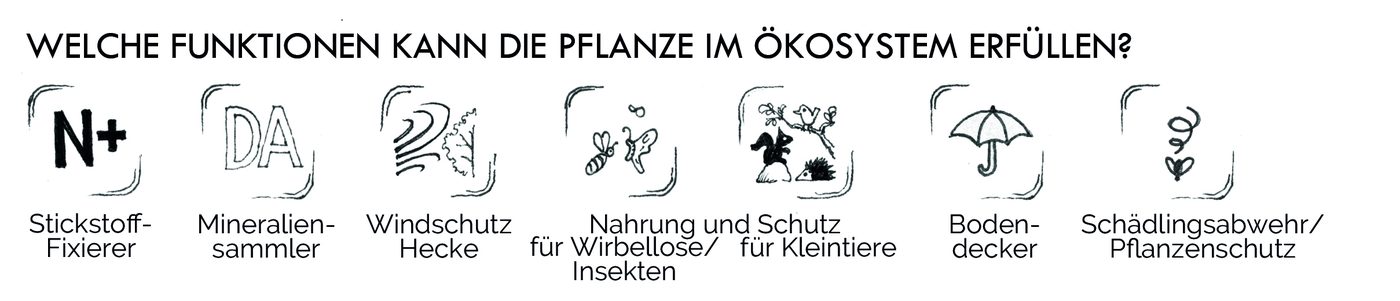
Gruppiert man die Pflanzen nach Funktionen und betrachtet die Beziehungen zwischen ihnen, kommt eine zweite Perspektive hinzu: die auf das gesamte Ökosystem. Um diese Komplexität zu fassen, sind die Arbeiten von Dave Jacke und Eric Toensmeier hilfreich. Sie präzisieren den Begriff Gilde, um die systemübergreifenden Wirkungen deutlich zu machen.
Diese Konzepte sind hier vereinfacht dargestellt; mehr in Dave Jackes Vorträgen und in „Edible Forest Gardens“ (siehe Quellen).
Beispiele für Polykulturen
Von Polykultur kann man schon sprechen, wenn im Intensivanbau mehr als eine Schicht gepflanzt wird. Solch ein Mischkulturanbau („companion planting“, „interplanting“) kann sich durchaus gegenseitig fördern, baut aber keine komplexen Wechselbeziehungen auf.
Diese entstehen erst, wenn Gehölze hinzukommen, meist als zentrales Element. Dann ist oft von Obstbaum-Lebensgemeinschaften die Rede: Obstbäume, die mit Förderpflanzen unterpflanzt werden.
Darüber hinaus sind alle möglichen Zusammenstellungen holziger und krautiger Pflanzen für besondere Designziele denkbar – die einzige Grenze ist die Fantasie. Ein typisches Beispiel ist eine Windschutzhecke; ähnlich kann Sicht- oder Lärmschutz der gewünschte Ertrag sein. Polykulturen können als Gründüngungsfläche für benachbarten Intensivanbau dienen, in Küchennähe kulinarische Nutzen erfüllen, Naturmaterialien für Kunst und Handwerk liefern und vieles mehr.
6QuellenLiteratur, Vorträge, Datenquellen
Grundlegende und weiterführende Quellen
- Balkep: The Polyculture Project
thepolycultureproject.com - Crawford, Martin (2022): Einen Waldgarten erschaffen. OLV
Original: Creating a Forest Garden (2010), Green Books - Jacke, Dave & Toensmeier, Eric (2005): Edible Forest Gardens, Band 1 und 2. Chelsea Green
- Jacke, Dave: Reframing and Deepening into Guilds and Polycultures (FFFG1)
Symposium – The Agroforestry Research Trust - Jacke, Dave: Gardening Like a Forest – Applied Ecological Design for Homesteads
YouTube - Jacke, Dave: Ecosystem Mimicry (Vortrag)
YouTube - Hemenway, Toby (2009): Gaia's Garden: A Guide to Home-Scale Permaculture. Chelsea Green (Kapitel 9)
- Holmgren, David: Das Wesen der Permakultur
PDF - Müller, Jörn: Ein Designprozess für Waldgärten. Vortrag beim Vernetzungstreffen des Waldgartenkongresses
YouTube - Müller, Jörn: Pop goes the canopy – a forest garden design tool
Agroforestry Research Trust, Vorträge 2023 - Müller, Jörn: Polykultur für den Nahrungsertrag unter trockenen Bedingungen
Permakultur-Plattform - Müller, Jörn: Polykultur für den Nahrungsertrag unter schattigen Bedingungen
Permakultur-Plattform - Toensmeier, Eric: Guidelines for Perennial Polyculture Design
permaculturenews.org - Quellcode der Software
github.com/js32/Perma-Guild-Forge
Datenquellen
- Plants For A Future
- pfaf.org – die Datenbank eignet sich auch für eine detaillierte Suche nach Nutzpflanzen.
- Wikidata
- wikidata.org – Namen, Bilder, Taxonomie.
- Edible Forest Gardens
- Artenliste „Species Toolkit“ (Lally Luck Farm), als Tabelle auf unserem Server.
- Karten
- OpenStreetMap, amtliche Luftbilder und Geländemodelle der Landesvermessungen, Sentinel-2 (EOX). Die jeweilige Quelle steht im Plan unten rechts.
Haben mehrere Quellen einen Wert, gewinnt die höher eingestufte (Standard: PFAF, dann Edible Forest Gardens, dann Wikidata; änderbar in den Einstellungen). Selbst eingetragene Werte werden nie überschrieben. Gespeichert wird die Endgröße der ausgewachsenen Pflanze; Spannen in Fuß rechnet das Programm über ihre Mitte um (25–35 ft → 9,1 m).
Bildrechte
Alle Bilder und Bildschirmfotos auf dieser Seite: Perma Design Kit und Permagruen, Lizenz CC BY-NC-SA 4.0.
7Das ProjektWer dahintersteht, woher die Idee kommt, wohin es gehen soll
Das Perma Design Kit ist ein freies Werkzeug zur Planung von Waldgärten und anderen permanenten Nutzpflanzensystemen. Die Software macht eine Nischenanalyse: Sie sammelt Daten zur ökologischen Nische einer Pflanze aus offenen Quellen und stellt sie auf verschiedene Arten dar. Neben Infokarten und Baumscheiben zum Auslegen zeigt sie die Pflanzen in filterbaren Listen und Kalendern. In einem nächsten Schritt entstehen Pflanzpläne in 2D und 3D. Alles läuft im Browser, ohne Konto, und die Daten bleiben auf deinem Gerät.
Unsere Motivation: Menschen dabei helfen, Waldgärten und andere dauerhafte Landnutzungssysteme anzulegen. Dabei wägen wir unseren ökologischen Fußabdruck gegen unseren Handabdruck ab. Daraus entsteht ein Pragmatismus, der für uns auch den Einsatz von KI beim Programmieren rechtfertigt.
Das Perma Design Kit will Teil eines Kulturwandels sein – hin zu einer Schenkökonomie und einem anderen Umgang mit Natur. Es ist ein freies Werkzeug, das allen gehört: geschenkt und weitergegeben, nicht verkauft.
Vision
Teil eines Kulturwandels sein – hin zu einer Schenkökonomie und einem fürsorglichen Umgang mit Natur. Dazu stellen wir ein Werkzeug bereit, das zu diesem Wandel beiträgt.
Das Werkzeug dafür: Menschen planen Polykulturen und Waldgärten nach den ökologischen Funktionen, dem Nutzen und dem Standort der Pflanzen – vom Pflanzensteckbrief über den Waldgartenplan bis zur Pflanzung draußen. Es soll dort helfen, wo geplant und gepflanzt wird: am Schreibtisch, im Feld und in Gruppen, Vereinen und Gemeinden.
Schenkökonomie: Wir verstehen das Kit als Gabe, nicht als Ware. Wir geben es weiter wie Saatgut oder Ableger – ohne Preis und ohne Gegenleistung zu verlangen – und vertrauen darauf, dass zurückkommt, was das Projekt trägt: Unterstützung, Wissen, Pflanzendaten, Übersetzungen, geteilte Pläne und Vorbilder. Das knüpft an die dritte Ethik der Permakultur an, das gerechte Teilen von Überschüssen (Fair Share), und an die wachsende Kultur der Commons.
Werte
Sieben Werte tragen das Projekt; jeder hat eine Folge, an der man ihn im Alltag prüfen kann.
Gemeingut
Das Werkzeug bleibt für alle frei und vollständig. Was mit Unterstützung finanziert wird, kommt allen zugute.
Jede Version wird nach zwei Jahren MIT (siehe Lizenz).
Schenken Vorschlag
Wir geben Werkzeug, Pläne und Wissen ohne Gegenleistung weiter und laden ein, zurückzugeben, was jede und jeder kann.
Unterstützen ist nie Bedingung; als Rückgabe zählen auch Wissen, Pflanzendaten, Übersetzungen und geteilte Vorbilder.
Nicht kommerziell
Geld kommt von Menschen und Stellen, die das Gemeingut wollen – nicht aus dem Verkauf des Werkzeugs.
Keine Werbung, kein Verkauf von Daten, keine bezahlten Funktionen, kein Konto als Pflicht.
Digitale Souveränität & Privatsphäre
Als Standard: Die Daten bleiben bei den Nutzenden. Alles liegt zuerst im Browser; Server-Speicher, Freigabe und Abgleich sind freiwillig. Was der Server nur umwandelt (QGIS, PFAF), speichert er nicht.
Ein Alleinstellungsmerkmal gegenüber kommerziellen Planungs-Apps.
Offenheit
Kosten offenlegen, die Herkunft jedes Pflanzenwerts sichtbar machen, Pflanzendaten als offenen Datensatz pflegen.
Quelle pro Feld (PFAF, EFG, Wikidata, Hand); geplant ist eine Seite „Was das Projekt kostet“.
Für alle bedienbar, barrierefrei
Ein Werkzeug für ein Gemeingut muss ohne Vorwissen, ohne Maus und in mehreren Sprachen nutzbar sein.
Einfacher Modus, Tastatur, Kontraste, Deutsch und Englisch, weitere Sprachen über die Gemeinschaft.
Respekt vor Quellen und Urhebern
Fremde Daten nur mit geklärter Erlaubnis; Urheber werden genannt.
NaturaDB bleibt aus (Lizenz und robots.txt ungeklärt); Sebastian Schucht und Jens Steger stehen in README und NOTICE.
Lizenz: Fair Source (FSL-1.1-MIT)
Seit dem 4. Oktober 2026 steht das Perma Design Kit unter der Functional Source License 1.1 mit MIT-Zukunftslizenz. Lizenzgeber sind Andreas Linder und Jörn Müller.
Was sie erlaubt
- Code nutzen, kopieren, verändern und weitergeben – für jeden Zweck außer einem konkurrierenden kommerziellen Angebot (das Werkzeug oder etwas sehr Ähnliches gegen Geld anbieten).
- Ausdrücklich erlaubt: interne Nutzung, Bildung und Forschung, Beratung, eine kostenlose eigene Instanz.
- Pflanzenkarten, PDFs und Gartenpläne, die jemand mit der App erstellt, gehören ihr oder ihm – auch für kommerzielle Zwecke.
- Jede Version wird zwei Jahre nach Veröffentlichung automatisch MIT.
- Versionen vor dem Wechsel und der PowerShell-Code in
legacy/bleiben MIT.
Warum diese Lizenz
- Sie schützt das Gemeingut davor, dass jemand das freie Werkzeug nimmt und als Bezahlprodukt gegen uns verkauft.
- Sie lässt alles zu, was zum Kulturwandel beiträgt: lernen, beraten, planen – Vereine und Gemeinden können es selbst betreiben.
- Nach zwei Jahren wird jeder Stand vollständig frei (MIT). Der Schutz gilt also nur für die neueste Entwicklung, das Wissen bleibt dauerhaft offen.
- Sie verkauft nichts: Es gibt kein Lizenzgeschäft. Das passt zu einem späteren gemeinnützigen Träger.
Ziele
Stand: 1. November 2026
- Jetzt(Wochen) Beta-Test und Kommentierung durch weitere Menschen. Vorstellung bei der Konferenz FFFG26. Finanzierung des Projekts: Träger für Unterstützung klären. Fehler beheben, Leistungstest bei jedem Deploy.
- Danach(1–2 Monate) Nutzen mit den Nutzenden abgleichen und einen Fahrplan für die weitere Entwicklung erstellen.
- Dann(ab 3 Monaten) Ideen aus der Werkstatt umsetzen.
Verbreiten – dort, wo Waldgärten geplant werden: geteilte Beispielprojekte und Vorbilder, Permakultur- und Agroforst-Netzwerke, Solawis, Vorträge (z. B. FFFG26), Newsletter, öffentliche Steckbriefe.
Worte, die wir verwenden
Sprache prägt, wie Menschen das Projekt erleben. Diese Worte passen zum Bild einer Schenkökonomie:
Produkt, AngebotWerkzeug, GemeingutEs gehört allen und wird nicht gehandelt.Kunden, UserGärtnernde, Gemeinschaft, MitwirkendeMenschen sind Teil des Projekts, nicht Abnehmer.verkaufen, anbietenschenken, weitergeben, teilenFür das, was das Projekt gibt. Geld, das ankommt, nennen wir nicht „Geschenk“ (steuerlich heikel).Spende, ZahlungBeitrag, UnterstützungFreiwilliges Zurückgeben ohne Gegenleistung; „Spende“ erst mit gemeinnützigem Träger.Preis, GebührBeitrag nach SelbsteinschätzungBei Workshops und Kursen.Fördermitgliedauch: Mittragende, UnterstützerkreisMenschen, die das Gemeingut tragen.Wachstum, ReichweiteVerbreitung, Weitergeben, AussäenDas Werkzeug verbreitet sich wie Saatgut.
Weitere passende Worte: Gabe, Fülle statt Knappheit, Gegenseitigkeit, Beitragskultur, Commoning, Überschuss teilen, Ableger, Saatgut-Tausch.
Wie das Tool entstand
- 2023Jörn Müller stellt das Werkzeug beim internationalen Waldgartensymposium unter dem Titel „Pop goes the canopy – a forest garden design multitool“ vor. Ausgangspunkt waren seine Beratungen für Waldgärten auf Gemeinschaftsflächen und die Entwicklung von Kursen.
- 2024/25Sebastian Schucht kontaktiert Jörn; aus der Zusammenarbeit entsteht eine erste Version als PowerShell-Skript, das Baumscheiben im Maßstab erzeugt.
- 2025/26Andi Linder übernimmt die Entwicklung, Sebastian steigt aus.
- 2026Jens Steger treibt die Entwicklung mit KI und weiterführenden Ideen zu Architektur, Bedienung und Server voran. Daraus entsteht eine Web-App mit Polykulturen, Kalendern und Waldgartenplan.
Fotos und Grafiken auf dieser Seite: aus der Projektdokumentation von Jörn Müller (permagrün).
Guide & documentation
Designing forest gardens with the Perma Design Kit
A digital planning tool for permanent food plant systems – a design tool for laying out forest gardens.
How to plan
On the floor
- Know your goal and site. Be clear about what you want to achieve. Observe sun, wind, water, soil and surroundings; research and record the site factors.
- Plant list. Import an existing list or search for the species you want under Plants and let the app complete the data.
- Print canopy cards. In the card view print the true-to-scale PDF (1:50), cut out and adapt.
- Make a base map. Transfer the site boundary at the same scale onto any surface, with the site data laid out clearly next to it.
- Place and move. By layers: trees first, then shrubs, then perennials, climbers last. Photograph the drafts and keep improving until every plant has a good spot.
In the forest garden plan
- Draw the area. Search an address and outline the garden on the map. Size, north and terrain follow from that.
- Place plants. Pick a plant and tap the area – one at a time, as a row or as a whole polyculture.
- Let it grow and check. Let it grow with the years slider in 2D or 3D, check the sunlight and close gaps in the functions.
Combine both: lay out and discuss together on the floor, then transfer the result into the forest garden plan, let it grow there, print and share it. Your data stays on your device.
1Idea & conceptWhy canopy cards on a base map
The Perma Design Kit grew out of the search for a flexible way to plan multi-layered forest gardens. Drawn plans are rigid and tedious to change. On a screen it is easier, but the sense of space and planning together get lost. Hence the idea of joining both worlds: canopy cards that characterise a plant and its traits are placed on a base map of the site, staked out beforehand at a tangible scale – playfully and as a team. Each card carries the key data on the plant’s ecological niche, so while placing it you keep in view what it needs and what it gives.
At the heart of it is the set of canopy cards, each showing the crown diameter of the mature plant at the chosen scale. The software lets you create and print such a set at any scale.
Below you find how to use the software for this and what else it offers.
2UsesSite design, planning together, education
Site design
The Perma Design Kit is a visual aid for site design, more precisely for placing elements (plants) concretely. It makes for better design in the sense of positioning elements as well as possible in relation to each other (“knowing what goes where”). The software produces the analogue canopy cards for printing; the site design can also be done digitally in the forest garden plan.
Either way it is a tool that works in a group too and lets people plan shared land together.
Education
The Perma Design Kit also works as a teaching and learning aid for all approaches to land use with trees. It conveys principles of site design playfully and trains the imagination for the dynamic webs of relationships in space and time that mark permanent systems.
Building and editing plant lists teaches specialised knowledge of ecological niches along the way. Creating and personalising a set of true-to-scale canopy cards has a particularly strong learning effect.
3The analogue toolSite analysis, base map, reading and printing canopy cards, placing plants
This is how the tool works as an analogue site design aid – the five steps are listed above under How to plan, here in detail.
From site analysis to base map
Usually you work on a specific site you know more or less about.
Gathering site data
Observation on site and research give you a collection of data on the site’s conditions and surroundings: general climate and microclimate, history of use, soils, existing plants and animals and much more.
Permaculture analysis methods such as sector analysis open further perspectives on that data. They show influences acting on the site from outside: the sun’s path over the year, wind, noise, views in and out. In residential settings zoning is useful too, dividing the site by how often and how intensively it is used.
Making the base map
- Take the site boundary from your own plans, public cadastral maps or architects’ scale drawings and draw the site at the scale of the printed cards (1:50 by default). As with drawn plans, an accurate scale matters for finding the right planting distances.
- There are many ways to do this: stake it out in a sandpit, tape it onto the floor with masking tape, draw it with chalk on a wall or a large surface – magnetic boards, pinboards, large posters, furniture boxes or rolls of wallpaper.
- Surrounding structures such as buildings and hedges can be shown with objects, e.g. boxes. With a movable light source their shade becomes tangible.
- To keep the site conditions present at all times, the analysis results are shown in simplified form – as an info sheet or, as here, an “info board”.
From plant list to a set of canopy cards
All card views aim to show a plant’s ecological niche, so that placing it rests on the best possible information. The key information is on the front: names, dimensions, needs and tolerances, uses and functions. The back is free for further notes.
The canopy card in detail
- Very top
- The rating as a useful plant, below it in the white field the botanical and common name. The symbol on the left shows the layer.
- Grey band
- The data that matter most for placing (see below).
- Lower half
- The two inner circles show the functions in the ecosystem, the outer one the yields for people, mostly products (see Placing the plants).
- Rings
- Outside the flowering time, inside the ripening and harvest time, each anticlockwise from January to December.
The grey band
- Growth
- slow – moderate – fast growing
- Height
- maximum height of the mature plant
- Crown diameter
- diameter of the mature crown, or spread for perennials
- Soil pH
- acid to neutral, neutral, neutral to alkaline
- Hardiness
- USDA zone
- Light
- the plant’s preference (optimum) from full sun through part shade to full shade
- Water
- water need combined with the soil’s drainage or water-holding capacity (free-draining, moist, wet)
- Soil soon
- sand – silt – loam – centre. If all four symbols are shown, the plant suits every soil.
Printing the set
In the card view under True-to-scale PDF. Each disc gets the crown width at the chosen scale, laid out on A4, A3 or A2.
- Scale 1:50
- The default. Covers medium to large sites, and the set stays handy. 4 m crown = 8 cm disc.
- Min. size 4 cm
- Smaller discs are not printed because they would hardly be readable. The app tells you which are missing.
- Fixed 6 cm + ring
- Every info circle is 6 cm, the outer ring shows the real crown size.
Making them your own
Print in colour or greyscale on paper or film and cut out the circles. It pays to adapt the prints to your situation and your own way of seeing: coloured paper or colouring in makes the discs easy to tell apart, and the back has room for more information.
From site draft to planting plan
Placing the plants
Where exactly a plant goes depends above all on the site conditions and the plant’s traits. So this information should always be present.
The simplest way to show the site analysis is a sheet with the key data. At the other end of the scale is an “info board” that shows north and the sun’s path plus rainfall, prevailing wind, hardiness zone and soil type. In our latitudes light is the limiting factor for systems that are productive on every level – so the sun’s path is the most important information for positioning individual plants.
The plant traits that matter for placing are on the canopy cards. Their functions are colour-coded, so the basic conditions for a polyculture are quickly visible – polyculture design by colours:
Documentation
With the analogue set, photos are the best way to record drafts. Clear, consistent file names keep the results in order. If you want to develop the drafts further professionally, transfer them into the digital forest garden plan, which offers features similar to a geographic information system (GIS).
Current limits
Readability of the cards
At the default scale of 1:50 only woody plants and large enough perennials (from about 1 m across) show well; on smaller circles the data is at the edge of readability. A variant with abbreviations instead of symbols is being tested and can help (Settings → View → Abbreviations instead of colour dots).
The early phases of planting show very well at the default scale: tree and shrub layers usually go in first, the herbaceous layers follow in later years.
Showing guilds
Whether all ecosystem functions are covered for all plants can only be judged to a limited extent so far. For single polycultures there is a provisional solution: irregularly cut-out shapes that stand for groups of herbaceous plants. Their information can be shown outside the plan, e.g. with the strip view.
A guild is not the same as a polyculture, though, because its members are not confined to one patch. The pollinator guild, for example, usually consists of flowering plants spread across the whole forest garden. For now we try to cover this complexity in the digital features Polycultures and Forest garden plan (see Polycultures & guilds).
4The software: permadesignkit.orgPlants, calendar, polycultures, forest garden plan, backups, shortcuts, outlook
Beyond the physical set of canopy cards, the software offers powerful tools, above all for the design phase of a design process.
Technical notes
The Perma Design Kit runs in the browser. It gathers data from public databases (mainly PFAF and Wikidata) and prepares it for different views. All imported data and your own entries are stored only in the browser and never leave your computer – until the browser’s storage is cleared. How to back them up is described under Backup, sharing, offline use.
The tool should work in all common browsers and on mobile devices. If it doesn’t, please report a bug.
Layout & use
On your first visit a tour explains the basics. The menu at the top holds the pages:
- Plants
- collecting the niche data and showing it graphically in different views
- Calendar
- flowering and harvest calendars
- Polycultures
- putting together functional plant communities
- Forest garden plan
- laying out a plant list on the real site (in development)
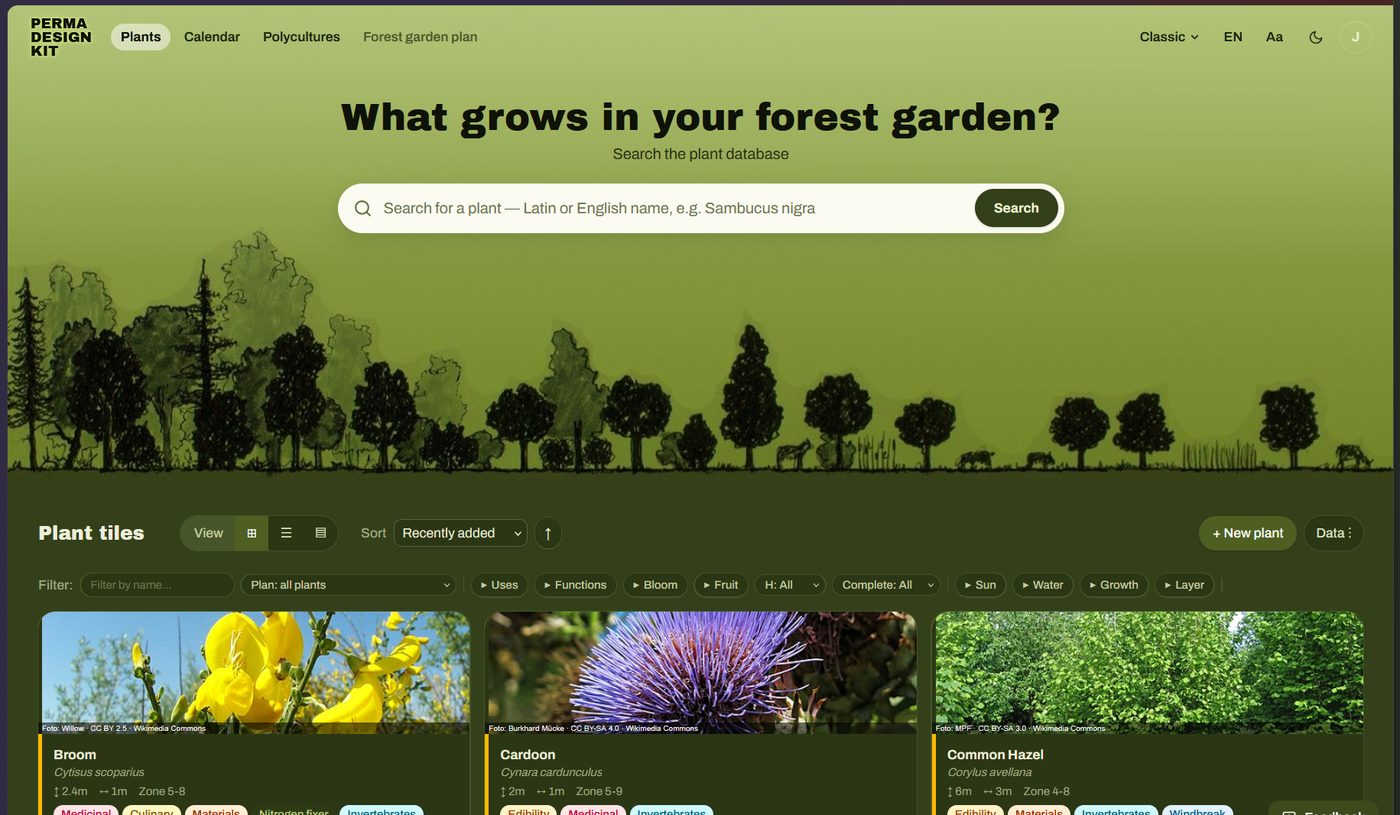
Plants
The core of the app: the collected data on the plants’ ecological niches, filterable and sortable in several views.
a) Starting a plant list from scratch
- Add a plant. The search box finds plants in the sources. Set the number of specimens right there.
New plantlets you enter everything by hand. - Let the app complete the data. Missing details come from PFAF, Edible Forest Gardens and Wikidata (see data sources).
- Correct and edit. Change any value in the edit dialog. The source tag then switches to M for manual, and that value is never overwritten.
It is important to adapt the plant data to your own situation: you need your own sizes for varieties, different rootstocks or older existing trees. The same goes when the size depends on management, e.g. trees grown as coppice (lime for salad leaves, hazel for poles, willow for basketry). Varieties also often have different flowering and ripening times.
b) Using existing lists
Read in ready-made plant lists as CSV or JSON via the Data menu. An example list, “Plants for small gardens” (42 species), is available there. Export tables from Excel as CSV and import them here.
Views
Every view has the Data button: complete data, import and export lists, create print views. The filter row sorts and filters the plants.

- Tiles
- Sortable, filterable overview with image, accent stripe by main use and completeness bar.
- List
- Sortable, filterable table. Select several plants and complete, delete, export or print them together.
- Canopy cards
- A further view alongside the tiles. The print buttons create the true-to-scale canopy cards as a PDF.
Symbols in the plant list
- Filled badges: the plant’s use (edible, medicinal, material …).
- Outlined chips: where a value came from, e.g. PFAF.
- Accent stripe on the left: main use in this order:edible/culinarymedicinalnitrogen fixerground coverinsect plant
- Data completeness: green from 80 %, yellow from 50 %, red below.
Editing
Open any plant for editing with the pencil button to fill in missing data and adapt it to your garden.
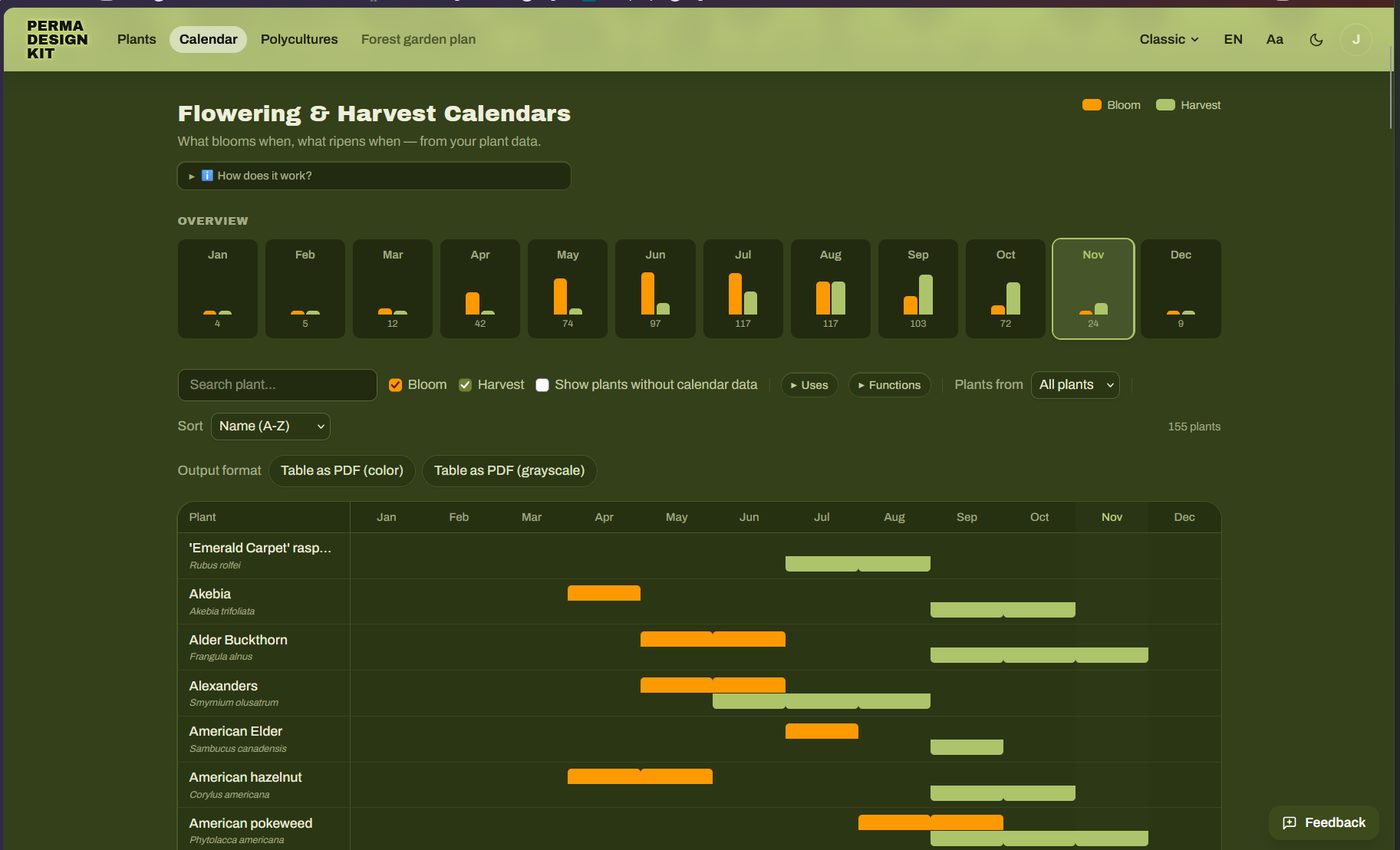
Calendar
Flowering and harvest periods as a calendar, sortable and printable as a PDF.
Polycultures
This tool suggests planting partners with similar needs and tolerances for light, water and soil pH. Saved polycultures can be placed in the forest garden plan as a unit. first draft, in development
Creating polycultures
- Choose an anchor species, often a central element such as a fruit tree.
- Add members, filling each role at least twice: companion, ground cover, nitrogen fixer, mineral accumulator, insect or scent plant, fruit or berry (see design principles for polycultures).
- The suggestion panel on the right shows matching plants from your list and further suggestions – the higher the number, the better light, water and pH match.
- Save.
Alternatively create a group in a plant’s edit dialog and turn it into a polyculture with Create from group. Ready-made example polycultures are in the page menu and in the sources.
Forest garden plan
The digital alternative to the set of canopy cards. This is where most development is still needed: a digital tool ultimately has to be complex enough for professional planning and compatible with GIS applications.
We are working out quite a few things. The tool already has many new features that are not public yet and want testing, among them:
- tree biographies and tasks: a timeline for every tree with assessments, harvest, pruning, care and photos
- better integration with (Q)GIS
- working on plans together as a team and sharing them
- a professional forest garden planner with layers, harvest gap analysis, windbreak, water flow and more
If you’d like to try the new features in the beta test: we look forward to your feedback, your support and your advice on where the tool should go. Maybe you even feel like joining in and becoming part of the team?
At the top right you choose how extensive the interface is. Simple walks you through the plan in three steps and shows five layers to fill – enough for most gardens. Classic shows all tools with a professional feature set. You can switch at any time; it only changes the interface, not the data in the plan. Independently of that, every plan can be viewed in 2D or 3D.
Creating a site plan and placing plants
+ New forest garden plan, search an address or choose My location, and click the corners of the site. Size, north and terrain follow from that. Without a location you get a plain grid.- Draw area for parts such as beds, pond and paths.
- Placing plants: pick a plant and click the area – one at a time, as a row at a fixed spacing or as a whole polyculture (Polyculture as package places anchor and members at once).
- Drag plants to move them, select several at once with the lasso. Dragging on empty ground pans the map.
- The years since project start slider (0–80) shows the estimated crown size in each year. Fast-growing plants are mature after about 6, medium ones after 15, slow ones after 30 years. Growth form and habit are shown in a simple standard way for now.
Map, aerial photo, terrain
The background comes from public data: OpenStreetMap, official aerial photos (8–40 cm, in 13 German states, Austria, Switzerland and the Netherlands) or a coarse satellite image. Terrain comes from official 1 m models where available. Buildings within about 150 m stand in 3D and cast shade.
Analyses
- Functions
- Effective guilds for the whole system: where the seven ecosystem functions act and where they are missing, with suggestions from your collection and Plant here.
- Sunlight
- Hours of sun per day with shade from tree crowns, terrain and buildings: sun from 6 h, part shade 3–6 h, shade below 3 h.
- Hints
- (experimental) Possible conflicts from plants of the same layer standing too close and unmet light needs, each for mature plants.
Tools and output
- several selection modes
- measuring
- saving an image
- drawing areas and outlines
- GPS data
- plant list with quantities and prices (CSV, PDF)
- calendar for this plan only
- PDF export
- GeoJSON for QGIS
- share link
Backup, sharing, offline use
- Backup
Settings → Data: save all data as a JSON file, also to move to another device. Can run automatically via WebDAV or Gist.- Export
- All or selected plants as CSV or JSON.
- Share link
- Plants, polycultures and plans are packed, compressed, into the link. Nothing is stored on the server.
- Install the app
- Android/Chrome: “Install app” prompt. iOS: Share icon → “Add to Home Screen”. After the first visit everything runs offline except search, data sources and the map.
Keyboard shortcuts
| / | Focus search |
| Esc | Close the open dialog |
| f | Filter the list by name |
| n | New plant |
| g l c | Switch view: tiles, list, cards |
| Shift + click | Select a range in the list |
| Alt + 1…9 | Menu items in order |
| ? | All shortcuts of the current page |
In the forest garden plan: 2/3 for 2D/3D, H V L M for pan, select, lasso, measure, F R U for area, row, outline, I/O for the years, J/K for the sun.
Outlook & getting involved
Planned development
Many more features are planned or already being tested:
- plant lists by design goal: food production systems, complex agroforestry, growing for health and more
- showing different succession phases in the plan
- polycultures and guilds: set your own criteria for suggestions and show guilds in space
- interchangeable uses and functions
- vector files for laser-cutting canopy cards from wood, MDF or plastic
Get involved & support
- Use the tool and give feedback, report bugs via report a bug
- Create plant lists and polycultures to share
- Contribute ideas and code on GitHub
- Help cover server and domain costs via support
- Try unreleased features in the beta test
5BackgroundDesign process, forest gardens, polycultures & guilds
For most people the tool works best in its simplified form. But it is designed to go much further and allows far more detail and customisation, so professional planning is possible too. Here we only give a short outline; for more depth see the sources below.
In general we want to answer the question of how our land use can be shaped in harmony with nature. For this we draw above all on ecology and the natural sciences, applied in the spirit of permaculture ethics and design principles. Most important is observing and imitating nature – from it we learn to “garden like the forest”.
Design process
Good design is most likely when you follow a design process. This logical sequence of phases ensures that we know as much as possible about the site before the actual site design begins. The better founded the site design, the more successful and productive the implementation. And the longer we let the process guide us, the better the design gets through repeated loops of evaluation and improvement.
Forest gardens
Unlike intensive growing of annuals, multi-layered permanent systems call for more complex, holistic thinking. Spatially alone we move from the almost two-dimensional vegetable bed into the third dimension. The biggest difference, though, is the fourth dimension: time. Forests are the most efficient ecosystems we can create and shape, so our goal is usually the climax stage of natural succession. What can take a millennium at nature’s pace can be sped up considerably through ecologically informed interventions.
It helps a lot to “fast-forward” time in your head and picture later stages of succession – to think in world time instead of human time. With some practice a successional imagination develops that opens up the time perspective and allows better decisions about where trees and shrubs go. In the forest garden plan the years slider helps with this.
For designing forest gardens and complex agroforestry systems we build on the established standard works: “Creating a Forest Garden” by Martin Crawford and the two volumes of “Edible Forest Gardens” by Dave Jacke and Eric Toensmeier (see sources).
Polycultures & guilds
Roughly speaking, a forest garden is a collection of polycultures: paths usually divide the site into bounded patches on which multi-layered plant communities grow. Ideally they cover the ecosystem functions their success requires – measured by the yields they are designed for. A fruit tree has the least stress in a community, because it supports and protects it with pollination, pest control, nutrients and ground cover.
Once you know the plants’ ecological niches, you can arrange them against the background of the site factors so that they deliver the yields you want.
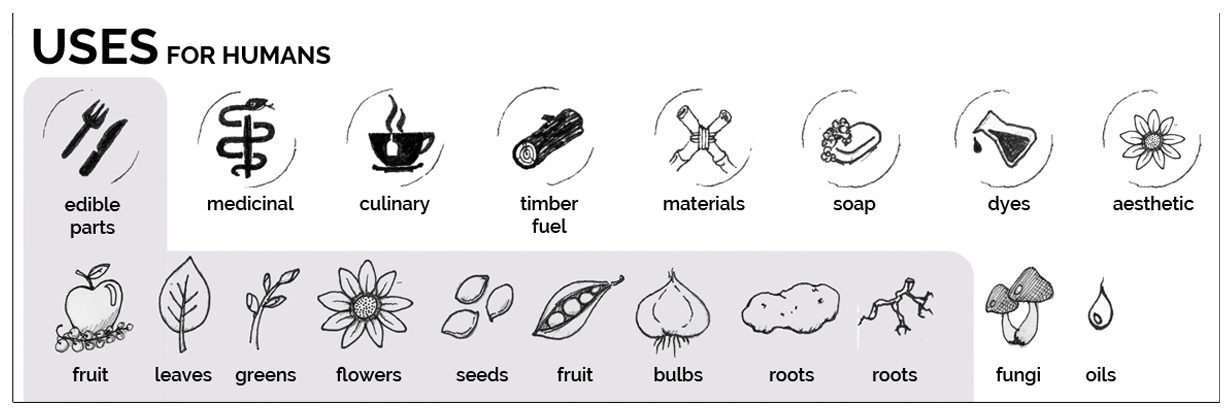
Designing successful polycultures follows these design principles:
- Relative location
- Place elements in relation to each other so that competition is low and cooperation is favoured.
- Stacking functions
- Each element fulfils as many functions as possible and so builds many relationships.
- Redundancy
- Each function is fulfilled by several elements, so it is reliably provided for the polyculture.
It also always helps to keep permaculture principles in mind: design from patterns to details, use and value diversity, integrate rather than segregate (see Holmgren in the sources).
Besides their uses for us, polycultures should also provide important functions for the ecosystem.
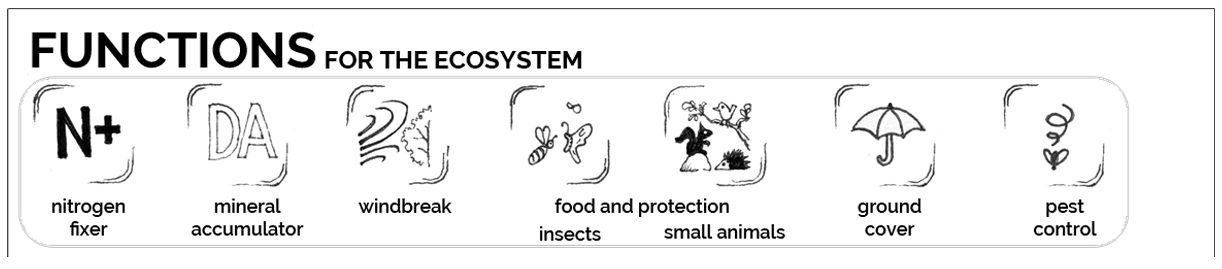
Grouping the plants by function and looking at the relationships between them adds a second perspective: that of the whole ecosystem. To grasp this complexity, the work of Dave Jacke and Eric Toensmeier is helpful. They sharpen the term guild to make the effects across the system visible.
These concepts are simplified here; more in Dave Jacke’s talks and in “Edible Forest Gardens” (see sources).
Examples of polycultures
You can already speak of a polyculture when more than one layer is planted in intensive growing. Such mixed cropping (“companion planting”, “interplanting”) can be mutually beneficial, but it does not build complex relationships.
Those only arise once woody plants join in, usually as the central element. People then often speak of fruit tree guilds: fruit trees underplanted with supporting plants.
Beyond that, all kinds of combinations of woody and herbaceous plants for special design goals are possible – the only real limit is imagination. A typical example is a windbreak hedge; screening from view or noise can be the desired yield as well. Polycultures can serve as green manure areas for neighbouring intensive beds, provide culinary uses near the kitchen, supply natural materials for arts and crafts, and much more.
6SourcesBooks, talks, data sources
Foundational and further reading
- Balkep: The Polyculture Project
thepolycultureproject.com - Crawford, Martin (2010): Creating a Forest Garden. Green Books
German: Einen Waldgarten erschaffen (2022), OLV - Jacke, Dave & Toensmeier, Eric (2005): Edible Forest Gardens, vol. 1 and 2. Chelsea Green
- Jacke, Dave: Reframing and Deepening into Guilds and Polycultures (FFFG1)
Symposium – The Agroforestry Research Trust - Jacke, Dave: Gardening Like a Forest – Applied Ecological Design for Homesteads
YouTube - Jacke, Dave: Ecosystem Mimicry (talk)
YouTube - Hemenway, Toby (2009): Gaia's Garden: A Guide to Home-Scale Permaculture. Chelsea Green (chapter 9)
- Holmgren, David: Essence of Permaculture (German edition)
PDF - Müller, Jörn: Ein Designprozess für Waldgärten (a design process for forest gardens), talk in German
YouTube - Müller, Jörn: Pop goes the canopy – a forest garden design tool
Agroforestry Research Trust, presentations 2023 - Müller, Jörn: polyculture for food under dry conditions (German)
Permakultur-Plattform - Müller, Jörn: polyculture for food under shady conditions (German)
Permakultur-Plattform - Toensmeier, Eric: Guidelines for Perennial Polyculture Design
permaculturenews.org - Source code of the software
github.com/js32/Perma-Guild-Forge
Data sources
- Plants For A Future
- pfaf.org – the database is also good for a detailed search for useful plants.
- Wikidata
- wikidata.org – names, images, taxonomy.
- Edible Forest Gardens
- “Species Toolkit” species list (Lally Luck Farm), hosted as a table on our server.
- Maps
- OpenStreetMap, official aerial photos and terrain models of the survey offices, Sentinel-2 (EOX). The source in use is shown at the bottom right of the plan.
When several sources have a value, the higher-ranked one wins (default: PFAF, then Edible Forest Gardens, then Wikidata; changeable in the settings). Values you enter yourself are never overwritten. The final size of the mature plant is stored; ranges in feet are converted via their middle (25–35 ft → 9.1 m).
Image rights
All pictures and screenshots on this page: Perma Design Kit and Permagruen, licence CC BY-NC-SA 4.0.
7The projectWho is behind it, where the idea comes from, where it is going
The Perma Design Kit is a free tool for planning forest gardens and other permanent food plant systems. The software performs a niche analysis: it gathers data on a plant’s ecological niche from open sources and presents it in different ways. Besides info cards and canopy cards for laying out, it shows plants in filterable lists and calendars. As a next step, planting plans are created in 2D and 3D. Everything runs in the browser, without an account, and the data stays on your device.
Our motivation: helping people create forest gardens and other lasting land use systems. In doing so we weigh our ecological footprint against our handprint. This leads to a pragmatism that, for us, also justifies using AI for programming.
The Perma Design Kit wants to be part of a cultural shift – towards a gift economy and a different way of relating to nature. It is a free tool that belongs to everyone: given and passed on, not sold.
Vision
To be part of a cultural shift – towards a gift economy and a caring relationship with nature. To that end we provide a tool that contributes to this shift.
The tool for it: people plan polycultures and forest gardens by the plants’ ecological functions, uses and site – from the plant profile through the forest garden plan to planting outside. It should help wherever planning and planting happen: at the desk, in the field, and in groups, associations and municipalities.
Gift economy: we see the kit as a gift, not a commodity. We pass it on like seeds or cuttings – without asking a price or anything in return – and trust that what sustains the project will come back: support, knowledge, plant data, translations, shared plans and examples. This ties in with the third ethic of permaculture, the fair sharing of surplus (fair share), and with the growing culture of the commons.
Values
Seven values carry the project; each has a consequence by which it can be checked in everyday practice.
Commons
The tool stays free and complete for everyone. Whatever is funded through support benefits everyone.
Every version becomes MIT after two years (see licence).
Giving proposal
We pass on tool, plans and knowledge without asking anything in return, and invite everyone to give back what they can.
Support is never a condition; knowledge, plant data, translations and shared examples count as giving back too.
Non-commercial
Money comes from people and bodies who want the commons – not from selling the tool.
No ads, no selling of data, no paid features, no mandatory account.
Digital sovereignty & privacy
By default the data stays with the people using it. Everything lives in the browser first; server storage, sharing and sync are optional. What the server only converts (QGIS, PFAF) it does not store.
A distinguishing feature compared with commercial planning apps.
Openness
Disclose costs, make the origin of every plant value visible, maintain the plant data as an open data set.
Source per field (PFAF, EFG, Wikidata, manual); a page “What the project costs” is planned.
Usable by all, accessible
A tool for a commons has to be usable without prior knowledge, without a mouse and in several languages.
Simple mode, keyboard, contrast, German and English, more languages through the community.
Respect for sources and authors
Third-party data only with clear permission; authors are credited.
NaturaDB stays off (licence and robots.txt unresolved); Sebastian Schucht and Jens Steger are named in README and NOTICE.
Licence: Fair Source (FSL-1.1-MIT)
Since 4 October 2026 the Perma Design Kit has been licensed under the Functional Source License 1.1 with MIT future licence. Licensors are Andreas Linder and Jörn Müller.
What it allows
- Using, copying, modifying and distributing the code – for any purpose except a competing commercial offering (offering the tool or something very similar for money).
- Expressly allowed: internal use, education and research, consulting, running your own free instance.
- Plant cards, PDFs and garden plans someone creates with the app belong to them – for commercial purposes too.
- Every version automatically becomes MIT two years after release.
- Versions from before the switch and the PowerShell code in
legacy/remain MIT.
Why this licence
- It protects the commons from someone taking the free tool and selling it against us as a paid product.
- It allows everything that contributes to the cultural shift: learning, consulting, planning – associations and municipalities can run it themselves.
- After two years every version becomes fully free (MIT). So the protection only covers the newest development; the knowledge stays open for good.
- It sells nothing: there is no licensing business. That fits a later non-profit body.
Goals
As of 1 November 2026
- Now(weeks) Beta test and feedback from more people. Presentation at the FFFG26 conference. Funding the project: settle a body to receive support. Fixing bugs, a performance test with every deploy.
- Next(1–2 months) Check the benefits with the people using it and draw up a roadmap for further development.
- Then(from 3 months) Build ideas from the workshop list.
Spreading it – where forest gardens are planned: shared example projects and models, permaculture and agroforestry networks, community-supported agriculture, talks (e.g. FFFG26), newsletter, public plant profiles.
Words we use
Language shapes how people experience the project. These words fit the picture of a gift economy (the list was written for German usage):
product, offeringtool, commonsIt belongs to everyone and is not traded.customers, usersgardeners, community, contributorsPeople are part of the project, not buyers.sell, offergive, pass on, shareFor what the project gives. Money that comes in we do not call a “gift” (tricky for tax).donation, paymentcontribution, supportGiving back voluntarily without anything in return; “donation” only once there is a non-profit body.price, feepay-what-you-can contributionFor workshops and courses.sponsoring memberalso: co-carriers, circle of supportersPeople who carry the commons.growth, reachspreading, passing on, sowingThe tool spreads like seed.
More fitting words: gift, abundance instead of scarcity, reciprocity, culture of contribution, commoning, sharing surplus, cuttings, seed swap.
How the tool came about
- 2023Jörn Müller presents the tool at the international forest garden symposium under the title “Pop goes the canopy – a forest garden design multitool”. It grew out of his consulting for forest gardens on community land and from developing courses.
- 2024/25Sebastian Schucht contacts Jörn; their collaboration produces a first version as a PowerShell script that generates canopy cards to scale.
- 2025/26Andi Linder takes over development, Sebastian leaves.
- 2026Jens Steger drives development forward with AI and further ideas on architecture, usability and server. The result is a web app with polycultures, calendars and the forest garden plan.
Photos and graphics on this page: from the project documentation by Jörn Müller (permagrün).
Guía & documentación
Diseñar bosques comestibles con el Perma Design Kit
Una herramienta digital de planificación para sistemas permanentes de plantas útiles – una herramienta de diseño para planificar bosques comestibles sobre el terreno.
Así se planifica
En el suelo
- Conoce tu objetivo y tu terreno. Ten claro qué quieres conseguir. Observa el sol, el viento, el agua, el suelo y el entorno; investiga y anota los factores del lugar.
- Lista de plantas. Importa una lista existente o busca las especies deseadas en Plantas y deja que la aplicación complete los datos.
- Imprimir fichas de copa. En la vista de fichas imprime el PDF a escala (1:50), recórtalas y adáptalas.
- Hacer el mapa base. Traslada el contorno del terreno a la misma escala a cualquier superficie y coloca al lado, bien visibles, los datos del lugar.
- Colocar y mover. Por estratos: primero los árboles, luego los arbustos, después las herbáceas y al final las trepadoras. Fotografía los borradores y sigue mejorando hasta que cada planta tenga un buen sitio.
En el plan de bosque comestible
- Dibujar la superficie. Busca una dirección y rodea el jardín en el mapa. El tamaño, la orientación al norte y el terreno se obtienen de ello.
- Colocar plantas. Elige una planta y toca la superficie – una a una, en hilera o como policultivo completo.
- Dejar crecer y revisar. Deja crecer el jardín con el control de años en 2D o 3D, revisa el soleamiento y cierra los huecos en las funciones.
Combinar ambos: colocar y debatir juntos en el suelo, luego trasladar el resultado al plan de bosque comestible, dejarlo crecer allí, imprimirlo y compartirlo. Tus datos se quedan en tu dispositivo.
1Idea & conceptoPor qué fichas de copa sobre un mapa base
El Perma Design Kit nació de la búsqueda de una forma flexible de planificar bosques comestibles de varios estratos. Los planos dibujados son rígidos y cuesta cambiarlos. En pantalla es más fácil, pero se pierden la sensación de espacio y la planificación en común. De ahí la idea de unir ambos mundos: fichas de copa que caracterizan una planta y sus rasgos se colocan sobre un mapa base del terreno, trazado antes a una escala tangible – de forma lúdica y en equipo. Cada ficha lleva los datos clave sobre el nicho ecológico de la planta, así que al colocarla tienes presente lo que necesita y lo que aporta.
El núcleo es el juego de fichas de copa, cada una con el diámetro de copa de la planta adulta a la escala elegida. El software permite crear e imprimir un juego así a cualquier escala.
Más abajo encontrarás cómo usar el software para ello y qué más ofrece.
2UsosDiseño del terreno, planificar en común, educación
Diseño del terreno
El Perma Design Kit es una ayuda visual para el diseño del terreno, más exactamente para colocar elementos (plantas) de forma concreta. Contribuye a un mejor diseño en el sentido de situar los elementos lo mejor posible unos respecto a otros («saber qué va dónde»). El software genera las fichas de copa analógicas para imprimir; el diseño del terreno también puede hacerse de forma digital en el plan de bosque comestible.
En ambos casos es una herramienta que funciona también en grupo y permite planificar juntos terrenos compartidos.
Educación
El Perma Design Kit también sirve como material didáctico para todos los enfoques de uso de la tierra con árboles. Transmite de forma lúdica principios del diseño del terreno y entrena la imaginación para las redes dinámicas de relaciones en el espacio y el tiempo que caracterizan a los sistemas permanentes.
Crear y editar listas de plantas enseña de paso conocimientos especializados sobre nichos ecológicos. Crear y personalizar un juego de fichas de copa a escala tiene un efecto de aprendizaje especialmente fuerte.
3La herramienta analógicaAnálisis del lugar, mapa base, leer e imprimir fichas de copa, colocar plantas
Así funciona la herramienta como ayuda analógica para el diseño del terreno – los cinco pasos están arriba en Así se planifica, aquí en detalle.
Del análisis del lugar al mapa base
Normalmente se trabaja en un terreno concreto que se conoce más o menos bien.
Reunir datos del lugar
La observación en el lugar y la investigación dan una colección de datos sobre las condiciones y el entorno del terreno: clima general y microclima, historia de uso, suelos, plantas y animales existentes y mucho más.
Los métodos de análisis de la permacultura, como el análisis de sectores, abren otras perspectivas sobre esos datos. Muestran las influencias que actúan desde fuera sobre el terreno: el recorrido del sol a lo largo del año, el viento, el ruido, las vistas hacia dentro y hacia fuera. En entornos residenciales también es útil la zonificación, que divide el terreno según la frecuencia y la intensidad de uso.
Hacer el mapa base
- Toma el contorno del terreno de tus propios planos, de mapas catastrales públicos o de planos a escala de arquitectos y dibuja el terreno a la escala de las fichas impresas (1:50 por defecto). Igual que en los planos dibujados, una escala exacta importa para encontrar las distancias de plantación adecuadas.
- Hay muchas maneras de hacerlo: trazarlo en un arenero, pegarlo en el suelo con cinta de carrocero, dibujarlo con tiza en una pared o en una superficie grande – pizarras magnéticas, tableros de corcho, carteles grandes, cajas de muebles o rollos de papel pintado.
- Las estructuras del entorno, como edificios y setos, pueden representarse con objetos, p. ej. cajas. Con una fuente de luz móvil su sombra se vuelve tangible.
- Para tener siempre presentes las condiciones del lugar, los resultados del análisis se muestran de forma simplificada – como hoja informativa o, como aquí, como «tablero de información».
De la lista de plantas al juego de fichas de copa
Todas las vistas de fichas buscan mostrar el nicho ecológico de una planta, para que su colocación se base en la mejor información posible. La información clave está en el anverso: nombres, dimensiones, necesidades y tolerancias, usos y funciones. El reverso queda libre para más notas.
La ficha de copa en detalle
- Arriba del todo
- La valoración como planta útil, debajo, en el campo blanco, el nombre botánico y el común. El símbolo de la izquierda indica el estrato.
- Banda gris
- Los datos más importantes para colocarla (ver abajo).
- Mitad inferior
- Los dos círculos interiores muestran las funciones en el ecosistema, el exterior los rendimientos para las personas, sobre todo productos (ver Colocar las plantas).
- Anillos
- Fuera la época de floración, dentro la época de maduración y cosecha, cada uno en sentido antihorario de enero a diciembre.
La banda gris
- Crecimiento
- lento – moderado – rápido
- Altura
- altura máxima de la planta adulta
- Diámetro de copa
- diámetro de la copa adulta, o extensión en las herbáceas perennes
- pH del suelo
- ácido a neutro, neutro, neutro a alcalino
- Rusticidad
- zona USDA
- Luz
- la preferencia (óptimo) de la planta, de pleno sol a media sombra y sombra total
- Agua
- necesidad de agua combinada con el drenaje o la capacidad de retención del suelo (bien drenado, húmedo, encharcado)
- Suelo pronto
- arena – limo – franco – centro. Si se muestran los cuatro símbolos, la planta se adapta a cualquier suelo.
Imprimir el juego
En la vista de fichas, en PDF (a escala). Cada disco recibe el ancho de copa a la escala elegida, distribuido en A4, A3 o A2.
- Escala 1:50
- El valor por defecto. Cubre terrenos medianos a grandes y el juego sigue siendo manejable. Copa de 4 m = disco de 8 cm.
- Tamaño mín. 4 cm
- Los discos más pequeños no se imprimen porque apenas se podrían leer. La aplicación indica cuáles faltan.
- Fijo 6 cm + anillo
- Cada círculo de información mide 6 cm, el anillo exterior muestra el tamaño real de la copa.
Hacerlas tuyas
Imprime en color o en escala de grises sobre papel o lámina y recorta los círculos. Merece la pena adaptar las impresiones a tu situación y a tu forma de ver: el papel de color o colorearlas hace que los discos se distingan fácilmente, y el reverso tiene sitio para más información.
Del borrador del terreno al plan de plantación
Colocar las plantas
Dónde va exactamente una planta depende sobre todo de las condiciones del lugar y de los rasgos de la planta. Por eso esta información debería estar siempre presente.
La forma más sencilla de mostrar el análisis del lugar es una hoja con los datos clave. En el otro extremo está un «tablero de información» que muestra el norte y el recorrido del sol, además de la precipitación, el viento dominante, la zona de rusticidad y el tipo de suelo. En nuestras latitudes la luz es el factor limitante para sistemas productivos en todos los estratos – por eso el recorrido del sol es la información más importante para situar cada planta.
Los rasgos de las plantas que importan para colocarlas están en las fichas de copa. Sus funciones están codificadas por colores, así que las condiciones básicas para un policultivo se ven rápidamente – diseño de policultivos por colores:
Documentación
Con el juego analógico, las fotos son la mejor manera de registrar los borradores. Nombres de archivo claros y coherentes mantienen los resultados en orden. Si quieres seguir desarrollando los borradores de forma profesional, trasládalos al plan de bosque comestible digital, que ofrece funciones parecidas a un sistema de información geográfica (SIG).
Límites actuales
Legibilidad de las fichas
A la escala por defecto de 1:50 solo se ven bien las leñosas y las herbáceas perennes lo bastante grandes (a partir de aprox. 1 m de diámetro); en círculos más pequeños los datos están al límite de la legibilidad. Se está probando una variante con abreviaturas en lugar de símbolos que puede ayudar (Ajustes → Vista → Abreviaturas en lugar de puntos de color).
Las primeras fases de la plantación se ven muy bien a la escala por defecto: los estratos de árboles y arbustos suelen plantarse primero, los estratos herbáceos siguen en años posteriores.
Representar gremios
Si todas las funciones del ecosistema están cubiertas para todas las plantas solo puede valorarse de forma limitada por ahora. Para policultivos sueltos hay una solución provisional: formas recortadas de manera irregular que representan grupos de plantas herbáceas. Su información puede mostrarse fuera del plano, p. ej. con la vista en tiras.
Sin embargo, un gremio no es lo mismo que un policultivo, porque sus miembros no se limitan a un parche. El gremio de polinizadores, por ejemplo, suele estar formado por plantas con flor repartidas por todo el bosque comestible. Por ahora intentamos abarcar esta complejidad con las funciones digitales Policultivos y Plan de bosque comestible (ver Policultivos & gremios).
4El software: permadesignkit.orgPlantas, calendario, policultivos, plan de bosque comestible, copias de seguridad, atajos, perspectivas
Más allá del juego físico de fichas de copa, el software ofrece herramientas potentes, sobre todo para la fase de diseño de un proceso de diseño.
Notas técnicas
El Perma Design Kit funciona en el navegador. Reúne datos de bases de datos públicas (sobre todo PFAF y Wikidata) y los prepara para distintas vistas. Todos los datos importados y tus propias entradas se guardan solo en el navegador y nunca salen de tu ordenador – hasta que se borre el almacenamiento del navegador. Cómo hacer copias de seguridad se describe en Copia de seguridad, compartir, uso sin conexión.
La herramienta debería funcionar en todos los navegadores habituales y en dispositivos móviles. Si no es así, informa de un error.
Estructura & uso
En tu primera visita un recorrido explica lo básico. El menú de arriba contiene las páginas:
- Plantas
- reunir los datos del nicho y mostrarlos gráficamente en distintas vistas
- Calendario
- calendarios de floración y cosecha
- Policultivos
- componer comunidades funcionales de plantas
- Plan de bosque comestible
- distribuir una lista de plantas sobre el terreno real (en desarrollo)
Plantas
El núcleo de la aplicación: los datos reunidos sobre los nichos ecológicos de las plantas, filtrables y ordenables en varias vistas.
a) Empezar una lista de plantas desde cero
- Añadir una planta. El campo de búsqueda encuentra plantas en las fuentes. Ahí mismo indicas el número de ejemplares. Con
+ Nueva plantaintroduces todo a mano. - Dejar que se completen los datos. Los datos que faltan vienen de PFAF, Edible Forest Gardens y Wikidata (ver fuentes de datos).
- Corregir y editar. Cambia cualquier valor en el diálogo de edición. La etiqueta de fuente pasa entonces a M de manual, y ese valor nunca se sobrescribe.
Es importante adaptar los datos de las plantas a tu propia situación: necesitas tamaños propios para variedades, distintos portainjertos o árboles viejos ya existentes. Lo mismo ocurre cuando el tamaño depende del manejo, p. ej. árboles en monte bajo (tilo para hojas de ensalada, avellano para varas, sauce para cestería). Las variedades también suelen tener otras épocas de floración y maduración.
b) Usar listas existentes
Lee listas de plantas ya hechas en CSV o JSON mediante el menú Datos. Allí hay una lista de ejemplo, «Plantas para jardines pequeños» (42 especies). Exporta tablas de Excel como CSV e impórtalas aquí.
Vistas
Cada vista tiene el botón Datos: completar datos, importar y exportar listas, crear vistas de impresión. La fila de filtros ordena y filtra las plantas.
- Mosaico
- Vista general ordenable y filtrable con imagen, franja de color según el uso principal y barra de completitud.
- Lista
- Tabla ordenable y filtrable. Selecciona varias plantas y complétalas, bórralas, expórtalas o imprímelas juntas.
- Fichas de copa
- Otra vista junto al mosaico. Los botones de impresión crean las fichas de copa a escala como PDF.
Símbolos en la lista de plantas
- Insignias rellenas: el uso de la planta (comestible, medicinal, material …).
- Etiquetas con borde: de dónde procede un valor, p. ej. PFAF.
- Franja de color a la izquierda: uso principal en este orden:comestible/culinariamedicinalfijadora de nitrógenocobertura del sueloplanta para insectos
- Completitud de datos: verde a partir del 80 %, amarillo a partir del 50 %, rojo por debajo.
Editar
Abre cualquier planta para editarla con el botón del lápiz, para rellenar los datos que faltan y adaptarla a tu jardín.
Calendario
Épocas de floración y cosecha como calendario, ordenable e imprimible como PDF.
Policultivos
Esta herramienta propone compañeras de plantación con necesidades y tolerancias parecidas de luz, agua y pH del suelo. Los policultivos guardados pueden colocarse como unidad en el plan de bosque comestible. primer borrador, en desarrollo
Crear policultivos
- Elige una especie ancla, a menudo un elemento central como un árbol frutal.
- Añade miembros y cubre cada función al menos dos veces: compañera, cobertura del suelo, fijadora de nitrógeno, acumuladora de minerales, planta para insectos o aromática, fruta o baya (ver principios de diseño de policultivos).
- El panel de sugerencias de la derecha muestra plantas adecuadas de tu lista y otras propuestas – cuanto más alto el número, mejor encajan luz, agua y pH.
- Guardar.
Otra opción: crea un grupo en el diálogo de edición de una planta y conviértelo en policultivo con Crear a partir de un grupo…. Hay policultivos de ejemplo ya hechos en el menú de la página y en las fuentes.
Plan de bosque comestible
La alternativa digital al juego de fichas de copa. Aquí es donde más desarrollo falta todavía: una herramienta digital tiene que ser, al final, lo bastante compleja para la planificación profesional y compatible con aplicaciones SIG.
Estamos trabajando en bastantes cosas. La herramienta ya tiene muchas funciones nuevas que aún no son públicas y quieren ser probadas, entre ellas:
- biografías de árboles y tareas: una línea de tiempo para cada árbol con valoraciones, cosecha, poda, cuidados y fotos
- mejor integración con (Q)GIS
- trabajar en planes juntos como equipo y compartirlos
- un planificador profesional de bosques comestibles con capas, análisis de huecos de cosecha, cortavientos, flujo del agua y más
Si quieres probar las nuevas funciones en la prueba beta: esperamos tus comentarios, tu apoyo y tus consejos sobre hacia dónde debe ir la herramienta. ¿Quizá incluso te apetece colaborar y formar parte del equipo?
Arriba a la derecha eliges cuán completa es la interfaz. Sencilla te guía por el plan en tres pasos y muestra cinco estratos por llenar – suficiente para la mayoría de los jardines. Clásica muestra todas las herramientas con un conjunto de funciones profesional. Puedes cambiar en cualquier momento; solo cambia la interfaz, no los datos del plan. Independientemente de eso, cada plan puede verse en 2D o 3D.
Crear un plano del terreno y colocar plantas
+ Nuevo plan de bosque comestible, busca una dirección o elige Mi ubicación y haz clic en las esquinas del terreno. El tamaño, la orientación al norte y el terreno se obtienen de ello. Sin ubicación obtienes una cuadrícula simple.- Dibujar superficie para partes como bancales, estanque y caminos.
- Colocar plantas: elige una planta y haz clic en la superficie – una a una, en hilera con una distancia fija o como policultivo completo (Policultivo como paquete coloca a la vez el ancla y los miembros).
- Arrastra las plantas para moverlas, selecciona varias a la vez con el lazo. Arrastrar sobre suelo vacío desplaza el mapa.
- El control Años desde el inicio del proyecto (0–80) muestra el tamaño estimado de la copa en cada año. Las plantas de crecimiento rápido son adultas tras unos 6 años, las medianas tras 15 y las lentas tras 30. Por ahora la forma de crecimiento y el porte se muestran de forma estándar sencilla.
Mapa, foto aérea, terreno
El fondo procede de datos públicos: OpenStreetMap, fotos aéreas oficiales (8–40 cm, en 13 estados federados alemanes, Austria, Suiza y los Países Bajos) o una imagen de satélite gruesa. El relieve procede de modelos oficiales de 1 m donde los hay. Los edificios en un radio de unos 150 m aparecen en 3D y proyectan sombra.
Análisis
- Funciones
- Gremios eficaces para todo el sistema: dónde actúan las siete funciones del ecosistema y dónde faltan, con sugerencias de tu colección y Plantar aquí.
- Soleamiento
- Horas de sol al día con la sombra de copas de árboles, terreno y edificios: sol a partir de 6 h, media sombra 3–6 h, sombra por debajo de 3 h.
- Avisos
- (experimental) Posibles conflictos por plantas del mismo estrato demasiado juntas y necesidades de luz no cubiertas, en ambos casos para plantas adultas.
Herramientas y salida
- varios modos de selección
- medir
- guardar una imagen
- dibujar superficies y contornos
- datos GPS
- lista de plantas con cantidades y precios (CSV, PDF)
- calendario solo para este plan
- exportación a PDF
- GeoJSON para QGIS
- enlace para compartir
Copia de seguridad, compartir, uso sin conexión
- Copia de seguridad
Ajustes → Datos: guarda todos los datos como archivo JSON, también para llevarlos a otro dispositivo. Puede hacerse automáticamente mediante WebDAV o Gist.- Exportar
- Todas las plantas o las seleccionadas como CSV o JSON.
- Enlace para compartir
- Plantas, policultivos y planes se empaquetan comprimidos en el enlace. No se guarda nada en el servidor.
- Instalar la aplicación
- Android/Chrome: aviso «Instalar aplicación». iOS: icono de compartir → «Añadir a pantalla de inicio». Tras la primera visita todo funciona sin conexión salvo la búsqueda, las fuentes de datos y el mapa.
Atajos de teclado
| / | Ir a la búsqueda |
| Esc | Cerrar el diálogo abierto |
| f | Filtrar la lista por nombre |
| n | Nueva planta |
| g l c | Cambiar de vista: mosaico, lista, fichas |
| Mayús + clic | Seleccionar un rango en la lista |
| Alt + 1…9 | Elementos del menú por orden |
| ? | Todos los atajos de la página actual |
En el plan de bosque comestible: 2/3 para 2D/3D, H V L M para desplazar, seleccionar, lazo, medir, F R U para superficie, hilera, contorno, I/O para los años, J/K para el sol.
Perspectivas & participar
Desarrollo previsto
Hay muchas más funciones previstas o ya en prueba:
- listas de plantas según el objetivo de diseño: sistemas de producción de alimentos, agroforestería compleja, cultivo para la salud y más
- mostrar distintas fases de sucesión en el plan
- policultivos y gremios: fijar criterios propios para las sugerencias y mostrar gremios en el espacio
- usos y funciones intercambiables
- archivos vectoriales para cortar con láser fichas de copa en madera, MDF o plástico
Participar & apoyar
- Usa la herramienta y danos tu opinión, informa de errores en informar de un error
- Crea listas de plantas y policultivos para compartir
- Aporta ideas y código en GitHub
- Ayuda a cubrir los costes del servidor y del dominio en apoyar
- Prueba funciones aún no publicadas en la prueba beta
5ContextoProceso de diseño, bosques comestibles, policultivos & gremios
Para la mayoría de las personas la herramienta funciona mejor en su forma simplificada. Pero está pensada para ir mucho más lejos y permite mucho más detalle y personalización, de modo que también es posible la planificación profesional. Aquí solo damos una breve introducción; para profundizar, mira las fuentes más abajo.
En general queremos responder a la pregunta de cómo puede organizarse nuestro uso de la tierra en armonía con la naturaleza. Para ello nos basamos sobre todo en la ecología y las ciencias naturales, aplicadas en el espíritu de la ética y los principios de diseño de la permacultura. Lo más importante es observar e imitar la naturaleza – de ella aprendemos a «cultivar como el bosque».
Proceso de diseño
Un buen diseño es más probable si se sigue un proceso de diseño. Esta secuencia lógica de fases garantiza que sepamos lo máximo posible sobre el terreno antes de que empiece el diseño propiamente dicho. Cuanto mejor fundamentado esté el diseño del terreno, más exitosa y productiva será la ejecución. Y cuanto más tiempo nos dejemos guiar por el proceso, mejor será el diseño gracias a bucles repetidos de evaluación y mejora.
Bosques comestibles
A diferencia del cultivo intensivo de anuales, los sistemas permanentes de varios estratos exigen un pensamiento más complejo y holístico. Solo en lo espacial pasamos del bancal de hortalizas, casi bidimensional, a la tercera dimensión. Pero la mayor diferencia es la cuarta dimensión: el tiempo. Los bosques son los ecosistemas más eficientes que podemos crear y modelar, así que nuestro objetivo suele ser la etapa clímax de la sucesión natural. Lo que al ritmo de la naturaleza puede llevar un milenio puede acelerarse mucho con intervenciones informadas por la ecología.
Ayuda mucho «adelantar» el tiempo mentalmente e imaginar etapas posteriores de la sucesión – pensar en tiempo del mundo en lugar de en tiempo humano. Con algo de práctica se desarrolla una imaginación sucesional que abre la perspectiva temporal y permite decidir mejor dónde van los árboles y arbustos. En el plan de bosque comestible ayuda a ello el control de años.
Para diseñar bosques comestibles y sistemas agroforestales complejos partimos de las obras de referencia consolidadas: «Creating a Forest Garden» de Martin Crawford y los dos volúmenes de «Edible Forest Gardens» de Dave Jacke y Eric Toensmeier (ver fuentes).
Policultivos & gremios
A grandes rasgos, un bosque comestible es un conjunto de policultivos: los caminos suelen dividir el terreno en parches delimitados en los que crecen comunidades de plantas de varios estratos. Idealmente cubren las funciones del ecosistema que su éxito requiere – medido por los rendimientos para los que se diseñan. Un árbol frutal sufre menos estrés en una comunidad, porque esta lo apoya y protege con polinización, control de plagas, nutrientes y cobertura del suelo.
Cuando conoces los nichos ecológicos de las plantas, puedes disponerlas teniendo en cuenta los factores del lugar para que den los rendimientos que deseas.
El diseño de policultivos exitosos sigue estos principios de diseño:
- Ubicación relativa
- Sitúa los elementos unos respecto a otros de forma que la competencia sea baja y se favorezca la cooperación.
- Apilamiento de funciones
- Cada elemento cumple tantas funciones como sea posible y así crea muchas relaciones.
- Redundancia
- Cada función la cumplen varios elementos, de modo que queda asegurada para el policultivo.
También ayuda siempre tener en cuenta los principios de la permacultura: diseñar de los patrones a los detalles, usar y valorar la diversidad, integrar en lugar de segregar (ver Holmgren en las fuentes).
Además de sus usos para nosotros, los policultivos también deberían aportar importantes funciones para el ecosistema.
Agrupar las plantas por funciones y mirar las relaciones entre ellas añade una segunda perspectiva: la del ecosistema en su conjunto. Para abarcar esta complejidad es útil el trabajo de Dave Jacke y Eric Toensmeier. Precisan el término gremio para hacer visibles los efectos a lo largo del sistema.
Estos conceptos se presentan aquí de forma simplificada; más en las charlas de Dave Jacke y en «Edible Forest Gardens» (ver fuentes).
Ejemplos de policultivos
Ya se puede hablar de policultivo cuando en el cultivo intensivo se planta más de un estrato. Estos cultivos asociados («companion planting», «interplanting») pueden beneficiarse mutuamente, pero no crean relaciones complejas.
Estas solo surgen cuando se suman plantas leñosas, normalmente como elemento central. Entonces se habla a menudo de gremios de frutales: árboles frutales con un sotobosque de plantas que los apoyan.
Más allá de eso, son posibles todo tipo de combinaciones de leñosas y herbáceas para objetivos de diseño especiales – el único límite real es la imaginación. Un ejemplo típico es un seto cortavientos; también la protección frente a miradas o ruido puede ser el rendimiento deseado. Los policultivos pueden servir de abono verde para bancales intensivos vecinos, ofrecer usos culinarios cerca de la cocina, proporcionar materiales naturales para artesanía y mucho más.
6FuentesLibros, charlas, fuentes de datos
Lecturas básicas y complementarias
- Balkep: The Polyculture Project
thepolycultureproject.com - Crawford, Martin (2010): Creating a Forest Garden. Green Books
En alemán: Einen Waldgarten erschaffen (2022), OLV - Jacke, Dave & Toensmeier, Eric (2005): Edible Forest Gardens, vol. 1 y 2. Chelsea Green
- Jacke, Dave: Reframing and Deepening into Guilds and Polycultures (FFFG1)
Symposium – The Agroforestry Research Trust - Jacke, Dave: Gardening Like a Forest – Applied Ecological Design for Homesteads
YouTube - Jacke, Dave: Ecosystem Mimicry (charla)
YouTube - Hemenway, Toby (2009): Gaia's Garden: A Guide to Home-Scale Permaculture. Chelsea Green (capítulo 9)
- Holmgren, David: La esencia de la permacultura (edición alemana)
PDF - Müller, Jörn: Ein Designprozess für Waldgärten (un proceso de diseño para bosques comestibles), charla en alemán
YouTube - Müller, Jörn: Pop goes the canopy – a forest garden design tool
Agroforestry Research Trust, presentaciones 2023 - Müller, Jörn: policultivo para producir alimentos en condiciones secas (en alemán)
Permakultur-Plattform - Müller, Jörn: policultivo para producir alimentos en condiciones de sombra (en alemán)
Permakultur-Plattform - Toensmeier, Eric: Guidelines for Perennial Polyculture Design
permaculturenews.org - Código fuente del software
github.com/js32/Perma-Guild-Forge
Fuentes de datos
- Plants For A Future
- pfaf.org – la base de datos también sirve para una búsqueda detallada de plantas útiles.
- Wikidata
- wikidata.org – nombres, imágenes, taxonomía.
- Edible Forest Gardens
- Lista de especies «Species Toolkit» (Lally Luck Farm), alojada como tabla en nuestro servidor.
- Mapas
- OpenStreetMap, fotos aéreas oficiales y modelos del terreno de los institutos cartográficos, Sentinel-2 (EOX). La fuente utilizada aparece abajo a la derecha en el plan.
Si varias fuentes tienen un valor, gana la de mayor prioridad (por defecto: PFAF, luego Edible Forest Gardens, luego Wikidata; se puede cambiar en los ajustes). Los valores que introduces tú nunca se sobrescriben. Se guarda el tamaño final de la planta adulta; los rangos en pies se convierten por su punto medio (25–35 ft → 9,1 m).
Derechos de las imágenes
Todas las imágenes y capturas de pantalla de esta página: Perma Design Kit y Permagruen, licencia CC BY-NC-SA 4.0.
7El proyectoQuién está detrás, de dónde viene la idea, hacia dónde va
El Perma Design Kit es una herramienta libre para planificar bosques comestibles y otros sistemas permanentes de plantas útiles. El software hace un análisis de nicho: reúne datos sobre el nicho ecológico de una planta a partir de fuentes abiertas y los presenta de distintas maneras. Además de fichas informativas y fichas de copa para colocar, muestra las plantas en listas filtrables y calendarios. Como paso siguiente se crean planes de plantación en 2D y 3D. Todo funciona en el navegador, sin cuenta, y los datos se quedan en tu dispositivo.
Nuestra motivación: ayudar a las personas a crear bosques comestibles y otros sistemas duraderos de uso de la tierra. Para ello sopesamos nuestra huella ecológica frente a nuestra «huella de la mano» (lo que aportamos). De ahí surge un pragmatismo que, para nosotros, también justifica usar IA para programar.
El Perma Design Kit quiere formar parte de un cambio cultural – hacia una economía del regalo y otra forma de relacionarse con la naturaleza. Es una herramienta libre que pertenece a todas las personas: regalada y transmitida, no vendida.
Visión
Formar parte de un cambio cultural – hacia una economía del regalo y una relación cuidadosa con la naturaleza. Para ello ponemos a disposición una herramienta que contribuye a ese cambio.
La herramienta para ello: las personas planifican policultivos y bosques comestibles según las funciones ecológicas, los usos y el lugar de las plantas – desde la ficha de la planta, pasando por el plan de bosque comestible, hasta la plantación al aire libre. Debe ayudar allí donde se planifica y se planta: en el escritorio, en el campo y en grupos, asociaciones y municipios.
Economía del regalo: vemos el kit como un regalo, no como una mercancía. Lo transmitimos como semillas o esquejes – sin pedir un precio ni nada a cambio – y confiamos en que vuelva lo que sostiene el proyecto: apoyo, conocimiento, datos de plantas, traducciones, planes y ejemplos compartidos. Esto enlaza con la tercera ética de la permacultura, el reparto justo de los excedentes (fair share), y con la creciente cultura de los bienes comunes.
Valores
Siete valores sostienen el proyecto; cada uno tiene una consecuencia con la que puede comprobarse en el día a día.
Bien común
La herramienta sigue siendo libre y completa para todas las personas. Lo que se financia con apoyos beneficia a todas.
Cada versión pasa a MIT al cabo de dos años (ver licencia).
Regalar propuesta
Transmitimos herramienta, planes y conocimiento sin pedir nada a cambio, e invitamos a todas las personas a devolver lo que puedan.
El apoyo nunca es una condición; el conocimiento, los datos de plantas, las traducciones y los ejemplos compartidos también cuentan como devolución.
Sin ánimo comercial
El dinero viene de personas y entidades que quieren el bien común – no de vender la herramienta.
Sin publicidad, sin venta de datos, sin funciones de pago, sin cuenta obligatoria.
Soberanía digital & privacidad
Por defecto, los datos se quedan con quienes los usan. Todo vive primero en el navegador; el almacenamiento en el servidor, compartir y sincronizar son opcionales. Lo que el servidor solo convierte (QGIS, PFAF) no lo guarda.
Un rasgo distintivo frente a las aplicaciones de planificación comerciales.
Transparencia
Hacer públicos los costes, mostrar el origen de cada valor de las plantas, mantener los datos de plantas como conjunto de datos abierto.
Fuente por campo (PFAF, EFG, Wikidata, manual); está prevista una página «Lo que cuesta el proyecto».
Utilizable por todas las personas, accesible
Una herramienta para un bien común tiene que poder usarse sin conocimientos previos, sin ratón y en varios idiomas.
Modo sencillo, teclado, contraste, alemán, inglés y español, más idiomas gracias a la comunidad.
Respeto por las fuentes y las autorías
Datos de terceros solo con permiso claro; las autorías se mencionan.
NaturaDB sigue desactivada (licencia y robots.txt sin aclarar); Sebastian Schucht y Jens Steger figuran en el README y en NOTICE.
Licencia: Fair Source (FSL-1.1-MIT)
Desde el 4 de octubre de 2026 el Perma Design Kit está licenciado bajo la Functional Source License 1.1 con MIT como licencia futura. Los licenciantes son Andreas Linder y Jörn Müller.
Qué permite
- Usar, copiar, modificar y distribuir el código – para cualquier fin excepto una oferta comercial competidora (ofrecer la herramienta o algo muy parecido a cambio de dinero).
- Expresamente permitido: uso interno, educación e investigación, asesoramiento, gestionar una instancia propia gratuita.
- Las fichas de plantas, los PDF y los planes de jardín que alguien crea con la aplicación le pertenecen – también para fines comerciales.
- Cada versión pasa automáticamente a MIT dos años después de su publicación.
- Las versiones anteriores al cambio y el código PowerShell en
legacy/siguen siendo MIT.
Por qué esta licencia
- Protege el bien común de que alguien tome la herramienta libre y la venda contra nosotros como producto de pago.
- Permite todo lo que contribuye al cambio cultural: aprender, asesorar, planificar – asociaciones y municipios pueden gestionarla por su cuenta.
- Al cabo de dos años cada versión pasa a ser totalmente libre (MIT). La protección solo cubre el desarrollo más reciente; el conocimiento queda abierto para siempre.
- No vende nada: no hay negocio de licencias. Eso encaja con una futura entidad sin ánimo de lucro.
Objetivos
A 1 de noviembre de 2026
- Ahora(semanas) Prueba beta y comentarios de más personas. Presentación en el congreso FFFG26. Financiar el proyecto: definir una entidad que reciba los apoyos. Corregir errores, una prueba de rendimiento con cada despliegue.
- Después(1–2 meses) Comprobar la utilidad con las personas que lo usan y elaborar una hoja de ruta para seguir desarrollándolo.
- Más adelante(a partir de 3 meses) Desarrollar ideas de la lista del taller.
Difundirlo – allí donde se planifican bosques comestibles: proyectos de ejemplo y modelos compartidos, redes de permacultura y agroforestería, agricultura sostenida por la comunidad, charlas (p. ej. FFFG26), boletín, fichas de plantas públicas.
Palabras que usamos
El lenguaje determina cómo se vive el proyecto. Estas palabras encajan con la imagen de una economía del regalo (la lista se escribió para el uso en alemán):
producto, ofertaherramienta, bien comúnPertenece a todas las personas y no se comercia con ella.clientes, usuariosjardineras y jardineros, comunidad, colaboradoresLas personas forman parte del proyecto, no son compradoras.vender, ofrecerregalar, transmitir, compartirPara lo que da el proyecto. Al dinero que entra no lo llamamos «regalo» (delicado a efectos fiscales).donación, pagoaportación, apoyoDevolver de forma voluntaria sin contrapartida; «donación» solo cuando exista una entidad sin ánimo de lucro.precio, tarifaaportación según tus posibilidadesPara talleres y cursos.socio protectortambién: cosostenedores, círculo de apoyoPersonas que sostienen el bien común.crecimiento, alcancedifundir, transmitir, sembrarLa herramienta se propaga como una semilla.
Más palabras adecuadas: regalo, abundancia en lugar de escasez, reciprocidad, cultura de la aportación, commoning, compartir excedentes, esquejes, intercambio de semillas.
Cómo surgió la herramienta
- 2023Jörn Müller presenta la herramienta en el simposio internacional de bosques comestibles con el título «Pop goes the canopy – a forest garden design multitool». Surgió de su asesoramiento a bosques comestibles en terrenos comunitarios y del desarrollo de cursos.
- 2024/25Sebastian Schucht contacta con Jörn; de su colaboración nace una primera versión como script de PowerShell que genera fichas de copa a escala.
- 2025/26Andi Linder asume el desarrollo, Sebastian lo deja.
- 2026Jens Steger impulsa el desarrollo con IA y más ideas sobre arquitectura, usabilidad y servidor. El resultado es una aplicación web con policultivos, calendarios y el plan de bosque comestible.
Fotos y gráficos de esta página: de la documentación del proyecto de Jörn Müller (permagrün).